


2100NEWS WEEKLY CRYPTO REPORT Jul-7

The NWST1100 index has decreased by 1.39% from the previous week. Over the last thirty days, Bitcoin has had the most favorable performance, surging by 13.90%.
*Below, we present a standardized weekly report and next week’s outlook, prepared based on the Theory Swingtum of intelligent finance. We gauge the crypto market’s breadth and direction by showing charts 2100NEWS Digital Assets Total Index (NWST1100), which measures 1100 (by market capitalization) significant crypto assets’ performance. The information-laden chart is difficult to read initially, but the graph shows essential price information, crucial decisive price levels, momentum, trading volumes, and crypto market breadth.
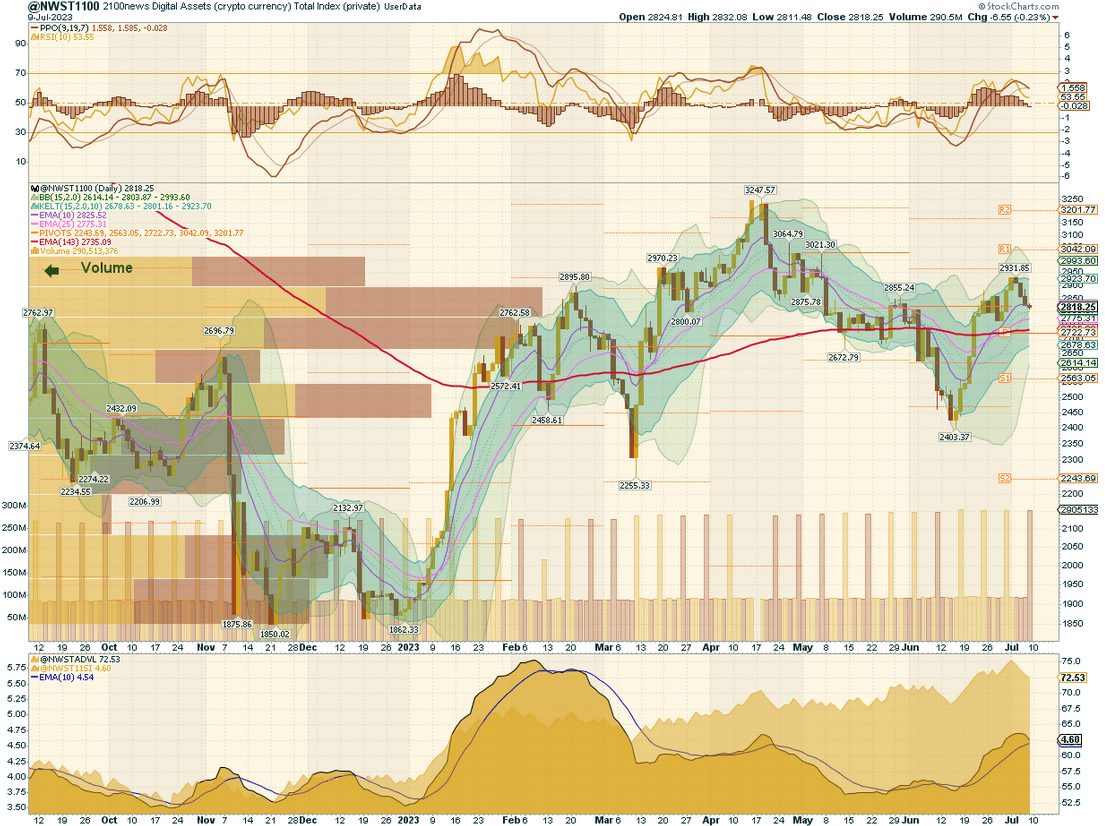
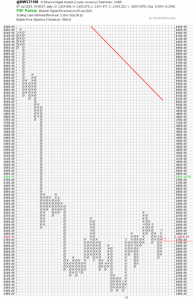
Analyzing the NWST1100 index chart, a significant benchmark index, revealed interesting observations on market trends. Here are the key points:
- The index retraced to the 10-DAY EMA (Exponential Moving Average), suggesting a pullback or correction in the market. The EMA is often used as a short-term support level.
- Negative market sentiment: The momentum indicators on the chart, such as the PPO lines, histogram, and RSI, indicate a negative market sentiment. The decrease in price momentum suggests a market upward momentum loss. Additionally, the decreasing RSI indicates a weakening of the market’s strength.
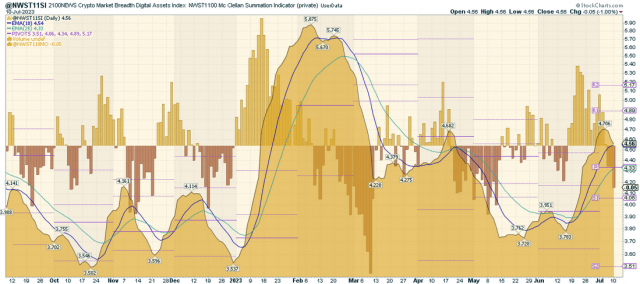
- Crypto Market Breadth indicators: The observations on the Crypto Market Breadth indicators at the bottom of the chart reveal a decrease in market breadth. The ADVL (Advance-Decline Line) falling suggests that there are more declining digital assets than advancing ones. The McClellan Summation Index falling also indicates a negative breadth in the market.
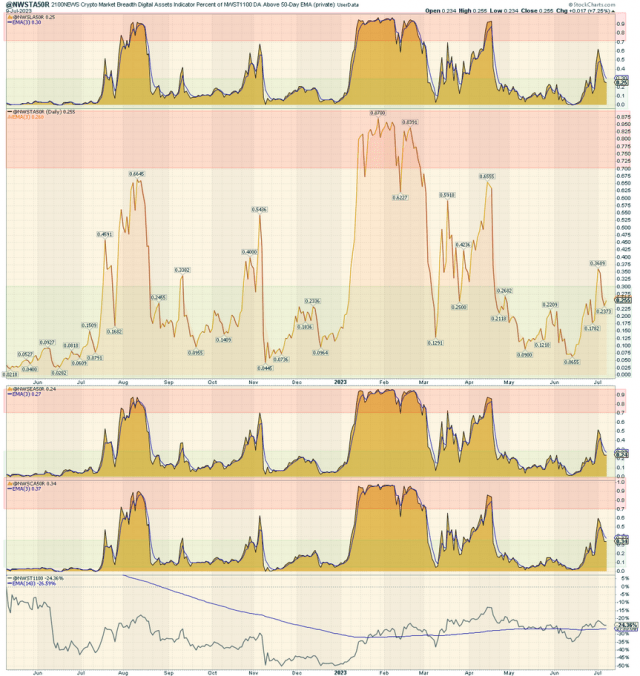 Considering these observations, it becomes evident that the cryptocurrency market is currently in a state of uncertainty and consolidation. The negative market sentiment and decreasing market breadth indicate a lack of overall bullishness. However, the oversold condition suggests the potential for a rebound or reversal in the market. The chart on the right shows that all four A50R lines are currently oversold after a retracement. This breadth indicator measures the percentage of digital assets trading above a 50-day moving average.
* The percentage of digital assets trading above a specific moving average is a breadth indicator that measures internal strength or weakness in the underlying index. The chart on the right side compares the percentage of DA trading above 50 days EMA for:
- 100 Large-caps members of NWSL100 (top box)
- 1100 members of NWST1100
- 100 Ethereum Tokens members of NWSET100
- 100 Coins members of NWSCo100 (bottom box)
Outlook for this week
Despite its inherent complexity and volatility, the crypto market exhibits some degree of predictability. Market behavior patterns can be discerned, although complete predictability is challenging. Examining the momentum indicators, several signals emerge for the near future. Here is an analysis of the near-term market outlook:
- RSI at 53: The RSI (Relative Strength Index) currently stands at 53, indicating a balanced state between buying and selling pressure prevailing in the market.
- The PPO (Percentage Price Oscillator) histogram and the PPO lines may continue to fall, indicating a potential continuation of decreasing price momentum. The PPO is a trend-following momentum indicator that measures the percentage difference between two moving averages. A downward movement suggests a weakening of price momentum. This could imply a slowdown or a potential shift toward a bearish trend.
- The Breadth indicators at the bottom of the first chart (NWST1100) may continue falling. The McClellan Summation Index, a long-term market breadth indicator relying on the McClellan Oscillator, indicates a continued decrease in market breadth. When the oscillator bars are below zero, it suggests a bearish momentum. This shows that the market breadth is currently in favor of declining assets.
Considering these signals suggests a market environment characterized by slightly bearish momentum. The concept of Pivot Points is a technical analysis tool used to identify potential support and resistance levels. Based on this setup, a consolidation above Pivot P is likely, indicating a pause in the prevailing trend and a period of stabilization or sideways movement in the market.
Performance of different groups of Digital Assets (Coins and Tokens)
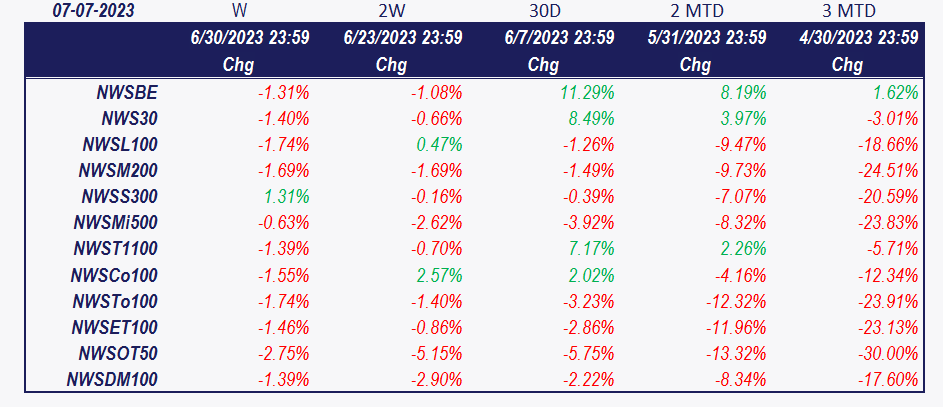
After analyzing the data in the table, the overall index NWST1100 has decreased by 1.39% over the past week. 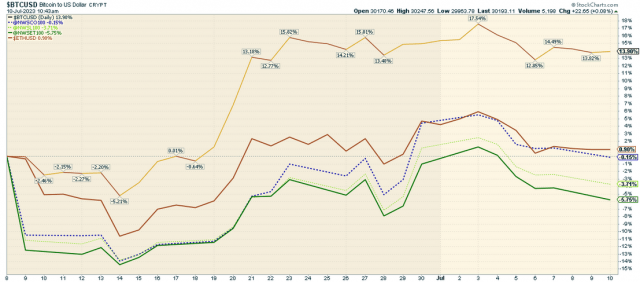 The chart below highlights the performance of various cryptocurrencies, such as Bitcoin, Ether, and the 2100NEWS Indices, which represent the performance of Ethereum-based tokens (NWSET100), Large caps (NWSL100), and Coins (NWSCo100). Over the last thirty days, Bitcoin has had the most favorable performance, surging by 13.90%. Conversely, Ethereum-based tokens, represented by the NWSET100 index, have had the poorest performance. The actions taken by the SEC against significant crypto exchanges have significantly impacted the performance of Ethereum-based tokens, as shown in the chart below.
Crypto (Digital Assets) compared with global equity
These comparisons provide insights into the relative performance of digital assets and traditional stocks over different time periods.
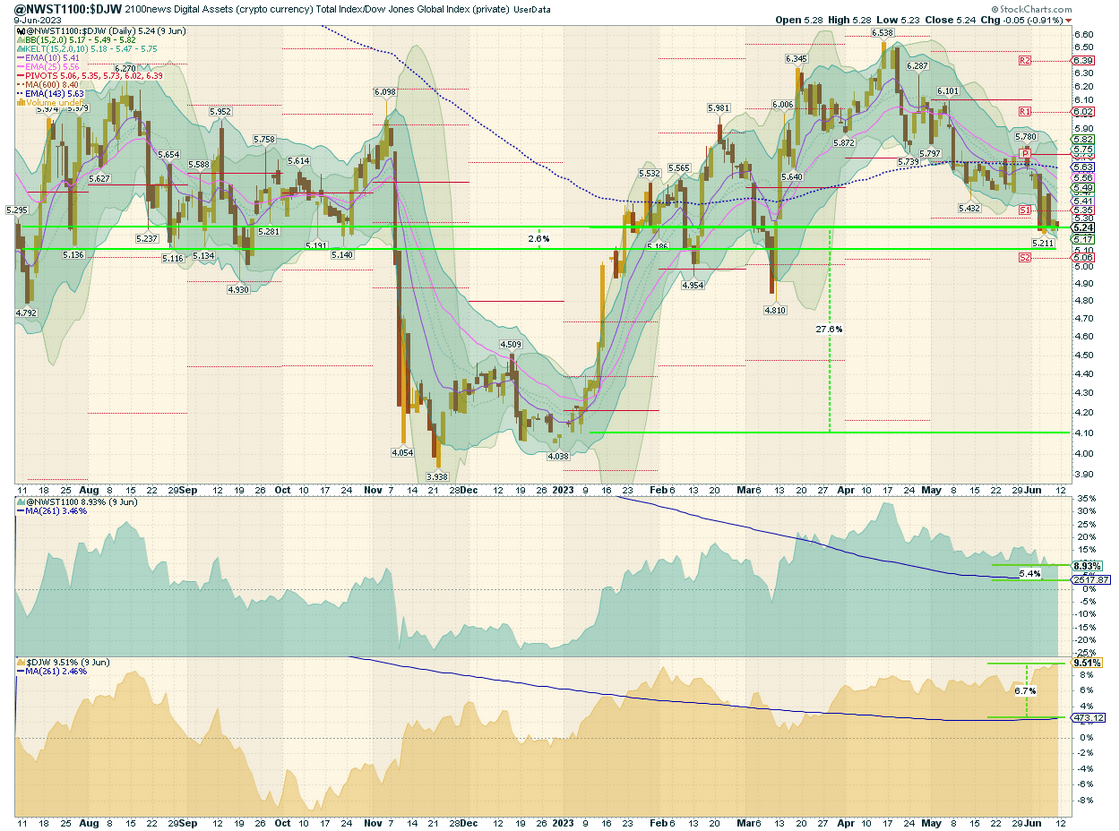
This comparison provides insights into the performance differences between digital assets (coins, tokens) and traditional stock; The NWST1100 represents digital assets, while the Dow Jones Global W1Dow index represents traditional stocks. Here are the key observations from the information you provided:
- Performance Comparison: 20 months ago, digital assets (represented by the NWST1100 index) were outperforming traditional stocks (represented by the W1Dow index), with a record high quotient between the two indexes. Over the past 12 months, digital assets have continued outperforming traditional stocks by 2.6%.
- Recent Shift: There has been a recent shift in performance in the current year, with the NWST1100 index outperforming the W1Dow index by 27.6%. This shift potentially indicates a resurgence in the performance of digital assets.
- Mean Reversion Opportunity: The blue dashed curve on the chart represents the average quotient price over 143 working days, which has been lower than the long-run mean at 8.40. This suggests that digital assets may present an opportunity for buying at lower prices based on the theory of Mean reversion. Mean reversion theory suggests that asset prices and historical returns tend to revert to their long-run means over time.
- Returns: The bottom two boxes on the chart depict the return achieved with the stock price (blue curves) generated if we bought one point of the respective index daily in the past year. The Crypto Index NWST1100 purchased stock experienced a 5.4% increase compared to the index’s current price. The DJW capital index experienced a 9.5% gain compared to a year ago and achieved a 6.7% return on the purchased stock based on buying one point daily.
*The box in the middle of the chart shows the original NWST1100 price; at the bottom is W1Dow.
 Lily
Lily Litecoin