


2100NEWS WEEKLY CRYPTO REPORT Feb-20

The NWST1100 index retraced to Fibonacci 62% near the lower symmetrical triangle’s trendline; it has fallen by 4.65% over the last week.
*Below, we present a standardized weekly report and next week’s outlook, prepared based on Swingtum Theory of intelligent finance. We gauge the crypto market’s breadth and direction by showing charts 2100NEWS Digital Assets Total Index (NWST1100), which measures 1100 (by market capitalization) significant crypto assets’ performance. The information-laden chart is difficult to read initially, but the graph shows essential price information, crucial decisive price levels, momentum, trading volumes, and crypto market breadth.
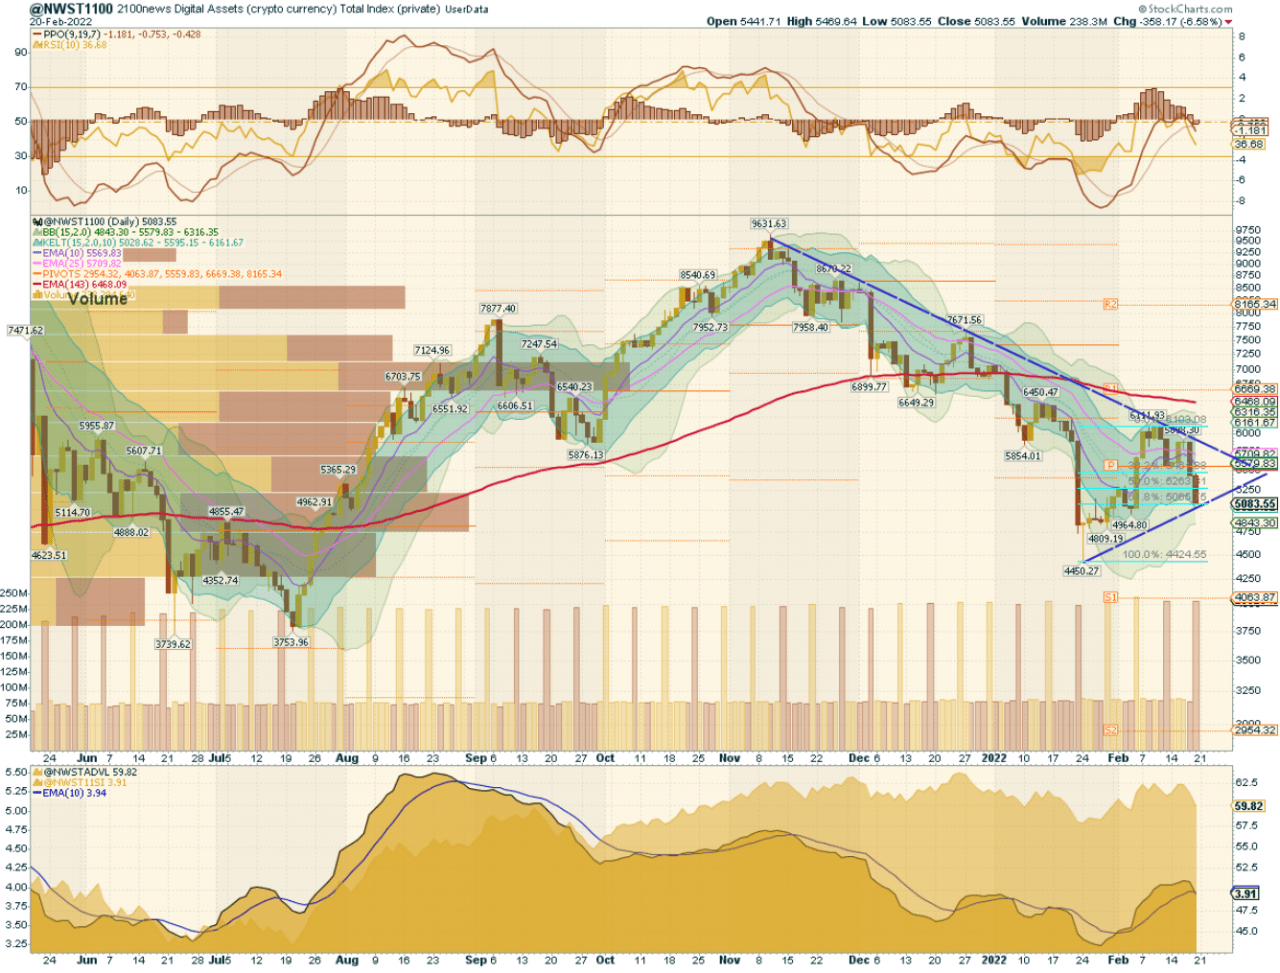
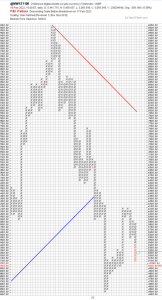
The previous report showed that our assumption for the last week had been: “a move near the lower trendline of the symmetrical triangle was likely.” The NWST1100 chart shows that the assumption proved correct; the index has retraced to Fibonacci 62% near the lower trendline of the symmetrical triangle. Momentum indicators at the top show: PPO lines, RSI, and the PPO histogram. These indicators and the Breadth indicators (at the bottom of the chart) have moved downward.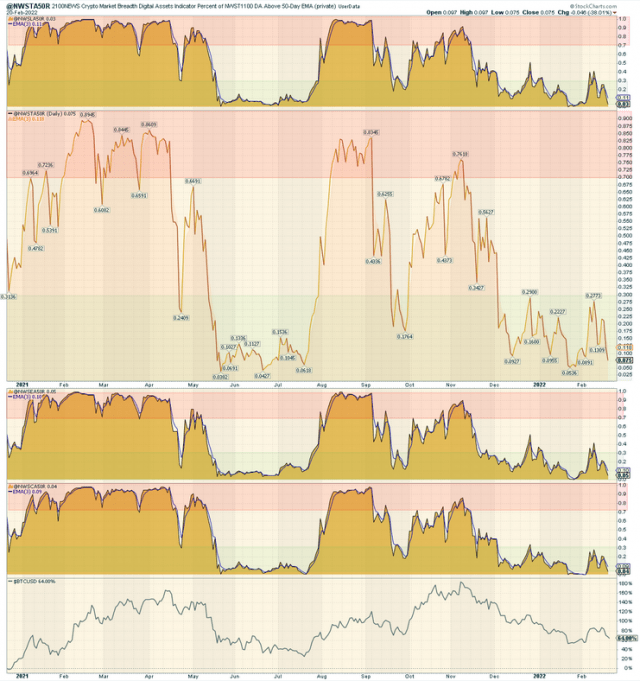
The chart on the right shows The percentage of digital assets trading above a 50-days moving average breadth indicator: All four A50R lines are oversold. They started bouncing from the oversold territory (below 30). In various measures of market breadth on the chart can be seen more clearly that the crypto markets were still in the downtrend.
* The percentage of digital assets trading above a specific moving average is a breadth indicator that measures internal strength or weakness in the underlying index. The chart on the right side compares the percentage of DA trading above 50 days EMA for:
- 100 Large-caps members of NWSL100 (top box)
- 1100 members of NWST1100
- 100 Ethereum Tokens members of NWSET100
- 100 Coins members of NWSCo100 (bottom box)
Outlook for this week
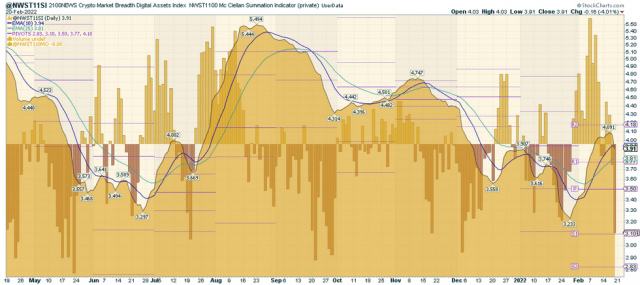
The waves are at least partially predictable due to their quasi-periodic nature; the area plots the McClellan Summation Index, a long-term measure of market breadth. The wave topped. The waves’ rhythm indicates that the continuation of the rising part of the wave is possible as in July. If we look ahead, the Momentum indicators give us the following signals: the RSI is 37; RSI, PPO lines, and PPO histogram. In the coming days, they may change direction, as can the Breadth indicators at the bottom of the chart. My opinion is based on this setup: a breakout from the triangle is likely (+15%), then the index price may test resistance represented by 143-day EMA. A move to Pivot S1 is possible but less likely.
Performance of different groups of Digital Assets (Coins and Tokens)
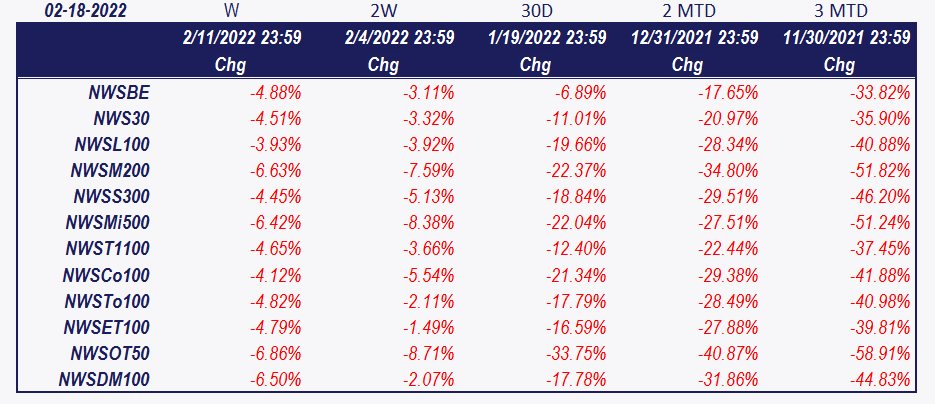
The table shows that the total (NWST1100) index has fallen by 4.65% over the last week. 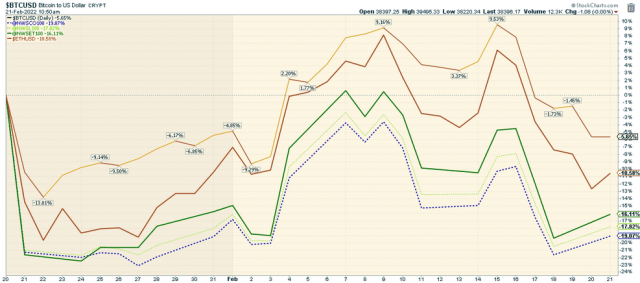 On the chart below, we can see Bitcoin, Ether, and the 2100NEWS DA Indexes, which measure the performance of Ethereum based tokens (NWSET100), Large caps (NWSL100), Coins (NWSCo100). Bitcoin (-5.65%) has been the best-performing during the previous thirty days.
Crypto (Digital Assets) compared with global equity
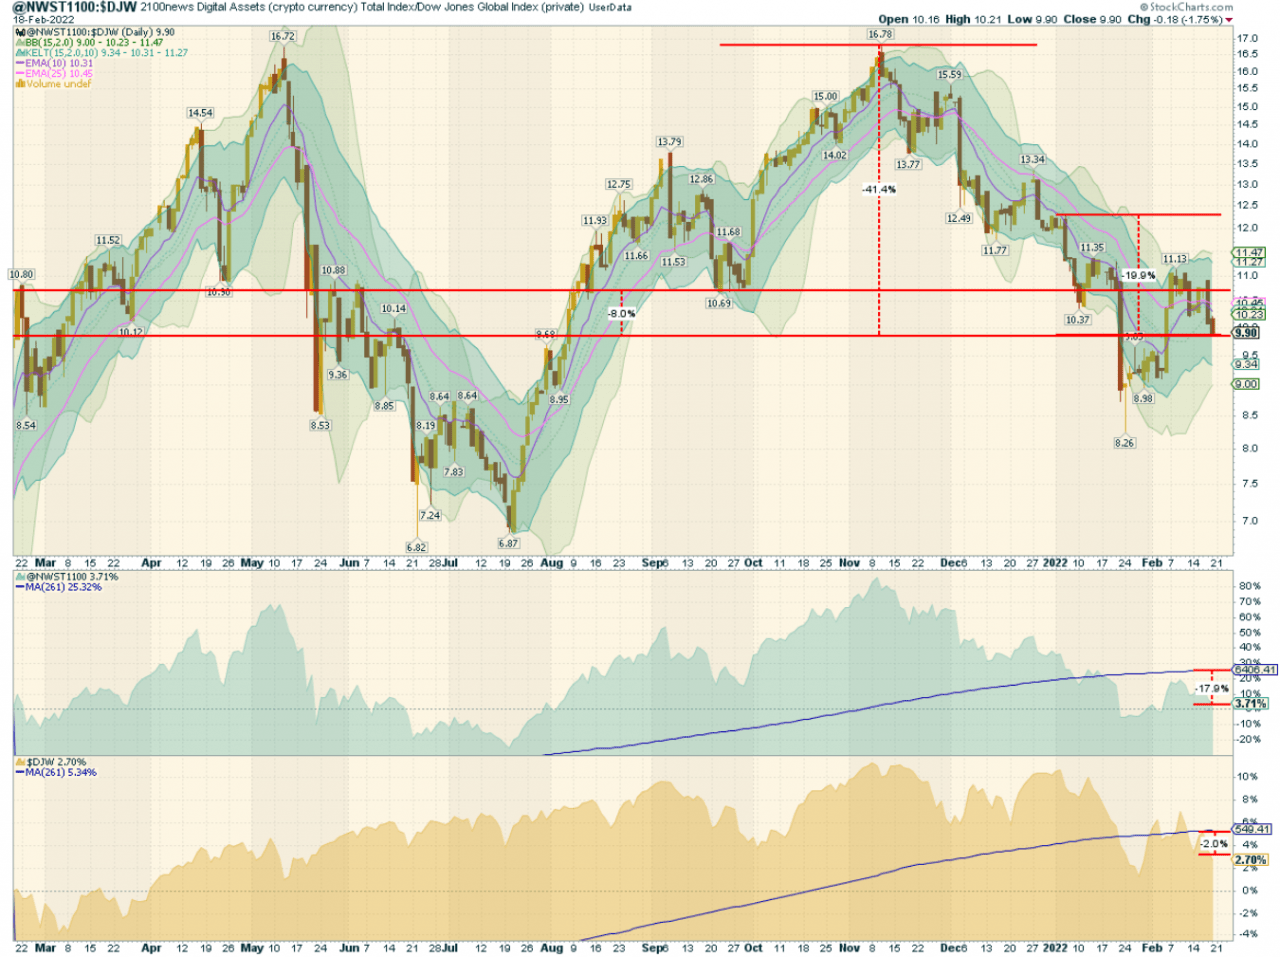
The chart compares the performance of the average Digital Asset (Coins, Tokens) represented by our NWST1100 index with the average global share represented by the Dow Jones global W1Dow index. Their quotient hit a record high three months ago; however, it is 41.4% lower now. The Percentage Change Marks on the chart show that W1Dow outperformed NWST1100 by 8% over the last 12 months, and this year, NWST1100 was 19.9% lower. The blue curve is the average index price during the previous twelve months. We can see that the NWST1100 spot price is 17.9% lower than twelve months index’s average price. That means: If we bought one NWST1100 every day over the last twelve months, our investment is recording a 17.9% loss today. However, the relatively cheaper NWST1100 index gives investors good buying opportunities.
*The box in the middle of the chart shows the original NWST1100 price; at the bottom is W1Dow.
 Lily
Lily Litecoin