


2100NEWS WEEKLY CRYPTO REPORT Feb-20

The crypto index NWST1100 decllined 1.08% last week. Over the past 30 days, Coins (NWSCo100) emerged as the strongest relative performer, posting the smallest loss of 24.12%.
*Below, we present a standardized weekly report and next week’s outlook, prepared based on the Theory Swingtum of intelligent finance. We gauge the crypto market’s breadth and direction by showing the 2100NEWS Digital Assets Total Index (NWST1100), which measures the performance of 1100 (by market capitalization) significant crypto assets. The information-laden chart is complex to read initially, but it effectively displays essential price information, key decision-making levels, momentum, trading volumes, and crypto market breadth. Monitoring Market Sentiment and Breadth is necessary to detect early signs of trend reversals or continued strength.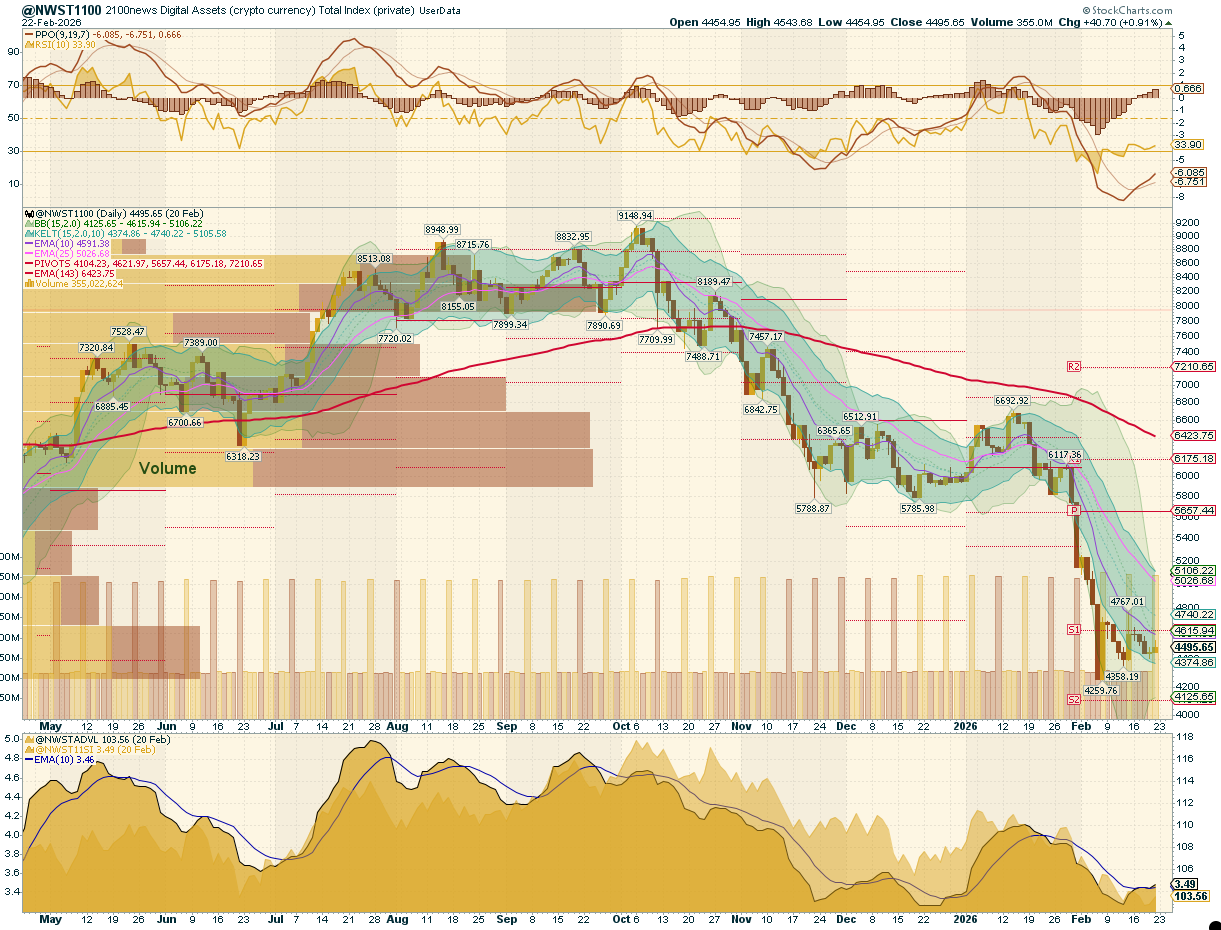
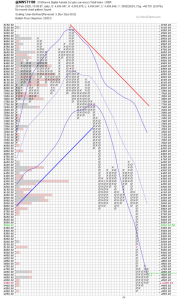
After conducting a detailed examination of the NWST1100 chart, a vital metric for the cryptocurrency market, several essential market dynamics and changes in market sentiment are revealed:
The NWST1100 index declined 1.08% over the past week. Following the prior week’s breakout impulse, follow-through proved inconsistent. Early strength faded into sharp intraday reversals and visible compression patterns, reflecting a market attempting to form a base but still constrained by overhead supply. The rebound effort remains technically fragile.
Market Sentiment (PPO & RSI): Downside momentum decelerated during the week, suggesting exhaustion rather than renewed liquidation. PPO lines have remained negative but upward-sloping, confirming the higher-timeframe trend remains bearish, while the PPO histogram has continued to rise, indicating that bearish momentum is losing intensity. The RSI ended around 34, recovering modestly but remaining below the neutral 50 level. This positioning is typical of a repair phase rather than a transition into expansion. Momentum is stabilizing, not strengthening.
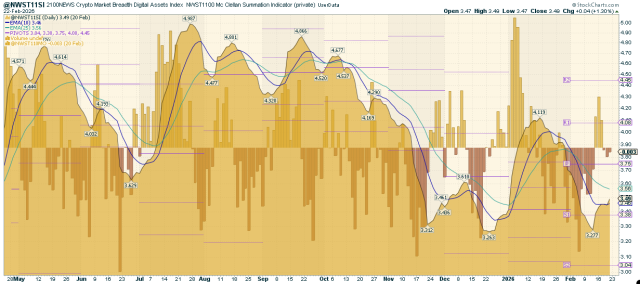
Crypto Market Breadth indicators: Breadth has improved from extreme weakness but remains structurally thin. The Advance-Decline Volume Line (ADVL), adapted by 2100News for the crypto market as ADVPL, tracks the net money volume of advancing versus declining digital assets. It has risen off the lows, suggesting liquidation-driven outflows have eased and flows are stabilizing. The McClellan Summation Index, a long-term version of the McClellan Oscillator that measures market breadth, flattened through most of the week, consistent with stabilization beneath the surface.
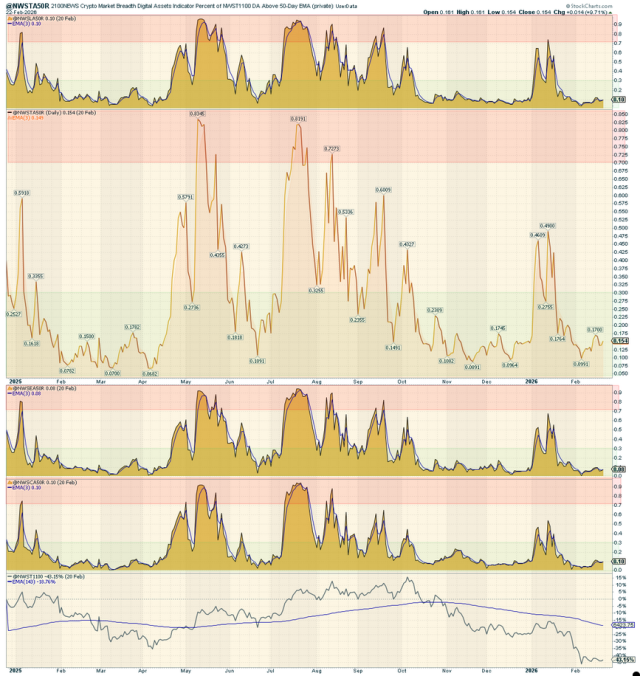
According to the chart on the right, all A50R indicators across the major segments (NWST1100, NWSET100, NWSL100, NWSCo100) have remained near capitulation territory. A50R readings — the share of assets trading above their 50-day EMAs — ended in the 8% to 15% range. The Ethereum Tokens (NWSET100) cohort remains the weakest, with only 8% of its constituents above their 50-day moving averages. This confirms that participation is still thin and the prevailing regime is therefore best described as “repair“, not a trend.
This breadth indicator measures the percentage of digital assets trading above a 50-day moving average.
* The percentage of digital assets trading above a specific moving average is a breadth indicator that measures internal strength or weakness in the underlying index. The chart on the right side compares the percentage of DA trading above the 50-day EMA for:
- Top panel: NWSL100 (Large Caps)
- Middle panel: NWST1100 (Total Market)
- Third panel: NWSET100 (Ethereum-based tokens)
- Bottom panel: NWSCo100 (Coins)
📉 Summary
The market remains in repair mode: stabilization is real (positive PPO histogram, improving breadth), but the bigger structure is still damaged (negative PPO lines, low A50R participation, heavy overhead resistance). This is not a clean trend transition yet—more a process of base construction with intermittent failed rallies and selective pockets of strength.
Outlook for this week
This report examines the cryptocurrency market’s short-term outlook, identifying patterns and signals that may offer insights into potential market direction. While predicting market behavior is inherently uncertain, discernible trends in momentum and market breadth indicators suggest possible developments.
- The market enters the new week at a structural inflection point. The transition from capitulation to stabilization has materially reduced forced selling pressure, but the rebound lacks the breadth and momentum typically required to sustain expansion. The dominant question for the week is not acceleration, but whether support holds under renewed testing.
- The RSI (Relative Strength Index) stood at 34 last week, consistent with post-capitulation conditions. While deeply oversold pressure has eased, RSI is likely to remain range-bound unless accompanied by a clear improvement in participation.
- The PPO histogram, which measures the rate of change (i.e., the first derivative) of the PPO lines, may rollover and is expected to trend lower at the beginning of the week. The key decision point will occur as it approaches the zero line. A rejection at the zero line would signal absorption of corrective pressure and support the formation of a double bottom, likely leading to a renewed relief rally. A decisive cross below the zero line would confirm that the higher-timeframe bearish trend remains dominant and open the path for a new downward leg. The market’s short-term direction will therefore be defined by how the histogram behaves at that zero-line inflection point. PPO lines may flatten; a sustained turn higher would require confirmation by the end of the week through a rising histogram.
- The Breadth indicators at the bottom of the first chart (NWST1100) reinforce this interpretation: The ADVPL suggests that forced capital outflows linked to liquidation may run their course. , but there is no evidence of renewed accumulation. At the same time, the McClellan Summation Index may flatten, reflecting repaired but not expanding participation.
📌 Target and Scenario Considerations:
Most likely scenario:
📍 Key Levels to Watch:
-
Support: 4,100 (Pivot S2)
-
Resistance: 4,800 (0.236 Fibonacci threshold)
Performance of different groups of Digital Assets (Coins and Tokens)
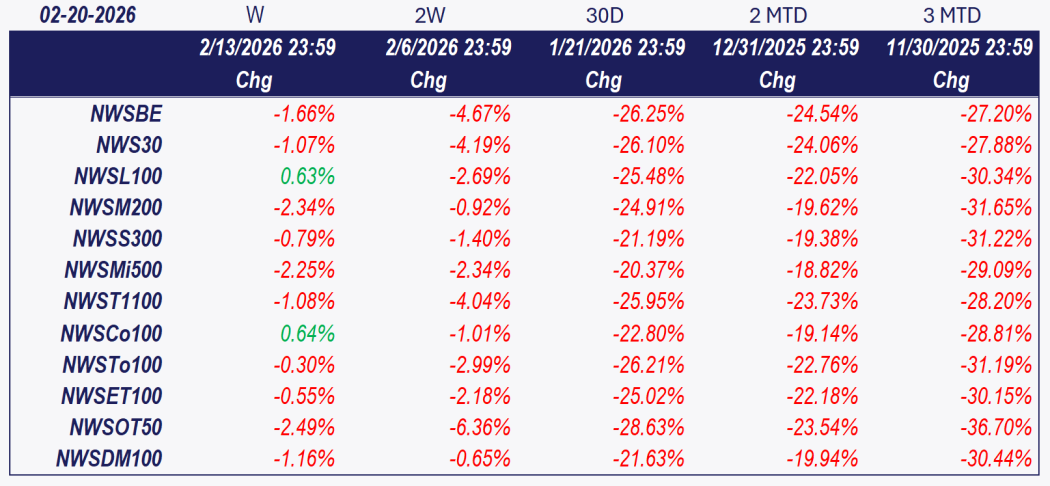
Investors and traders rely on historical performance data to contextualize short-term moves and assess the relative strength of different market segments. The latest table shows a decline across most categories, with the NWST1100 index down 1.08% over the past week. 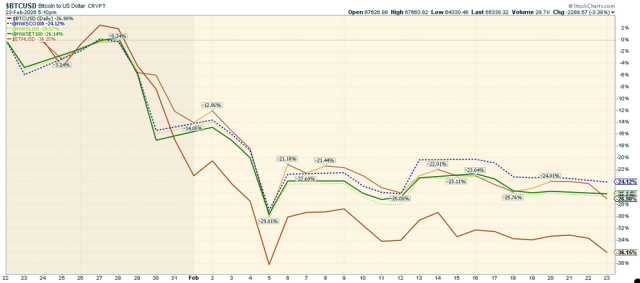 The chart above highlights the performance of various cryptocurrencies, including Bitcoin, Ether, and the 2100NEWS Indices, which represent Ethereum-based tokens (NWSET100), large caps (NWSL100), and Coins (NWSCo100). Over the past 30 days, Coins (NWSCo100) emerged as the strongest relative performer, posting the smallest loss of 24.12%.
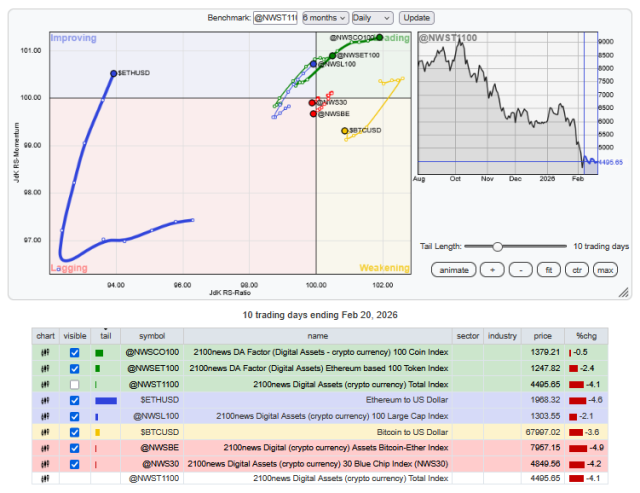
While the broader market has fallen, different segments and individual cryptocurrencies exhibit distinct performance dynamics.
Performance Trends by Market Segment:
✔ NWSCo100 (Coins) and NWSET100 (Ethereum-based tokens) led the market,
✔ Ether and NWSL100 (Large Caps) have been improving.
✔ Bitcoin has been weakening.
✔ NWS30 and NWSBE lagged.
Investors and traders might use this information to adjust their portfolios, possibly shifting focus toward assets with stronger relative momentum while being cautious about those in the Weakening quadrant.
*RRG® charts show the relative strength and momentum of groups of digital assets. Those with strong relative strength and momentum appear in the green Leading quadrant. As relative momentum fades, they typically move into the yellow Weakening quadrant. If relative strength then fades, they move into the red Lagging quadrant. Finally, when momentum picks up again, they shift into the blue Improving quadrant.
Crypto (Digital Assets) compared with global equity
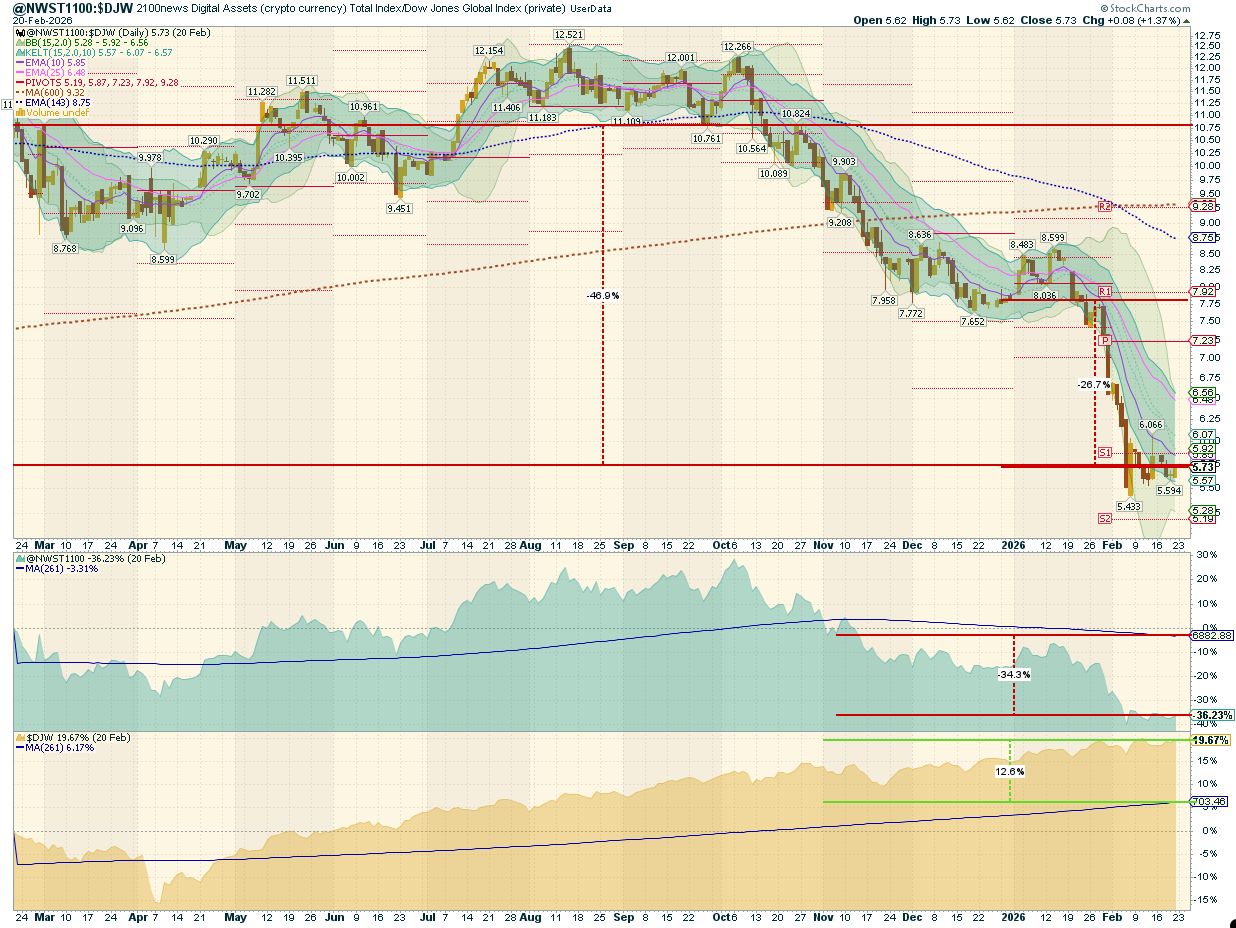
This report offers a comprehensive analysis comparing the performance of digital assets, as measured by the NWST1100 index, to that of shares on global capital markets, as represented by the Dow Jones Global W1Dow index. The comparison spans multiple timeframes, providing insights into historical and recent performances and potential future trends.
Let’s break down the key observations and implications:
- Historical Performance Comparison:
- 51 Months Ago: Digital assets vastly outperformed global equities in global capital markets, reaching a record high in the comparative quotient between the NWST1100 and W1Dow indexes. At this juncture, digital assets displayed a notably superior performance trajectory compared to shares on global capital markets.
- Over the past twelve months, digital assets have underperformed equities by 46.9%.
- Mean Reversion Opportunity:
- Over the past 143 working days, the average quotient price, represented by the blue-dashed curve, stands at 8.75, while the current spot ratio is 5.73, which is lower than the long-term mean of 9.32, which has increased since October 2024.
- The mean-reversion theory posits that asset prices tend to revert to their historical average returns over time. The current NWST1100-to-DJW price ratio, which is below the long-run mean, may indicate that digital assets are undervalued relative to historical trends.
- Returns Comparison:
- The chart also presents the returns achieved by the simplified index-based accumulation approach—buying one index point per day over 12 months—to simulate the mechanical accumulation of exposure. While this method is not equivalent to classical dollar-cost averaging (which involves investing a fixed amount of capital daily), it provides a consistent benchmark for comparing historical costs and returns. The NWST1100 Crypto Index has dropped by 36.23% over the past twelve months. With daily index investments, an investor’s stock price would have resulted in a 34.3% loss from the current index price, because of unprofitable purchases at high entry prices during a prolonged market uptrend when prices remained above the 143-day moving average for an extended period.
- The DJW, a broad-based global equity index, has risen 19.67% over the past 12 months. However, a daily-purchase strategy would have yielded a 12.6% gain.
- Conclusion:
*The box in the middle of the chart shows the original NWST1100 price; at the bottom is W1Dow.
 Lily
Lily Litecoin