


2100NEWS WEEKLY CRYPTO REPORT Jul-11

The crypto index NWST1100 soared 11.71%, marking its strongest week in months. Coins represented by the NWSCo100 index have outperformed other segments, surging by 17.83% in the previous thirty days.
*Below, we present a standardized weekly report and next week’s outlook, prepared based on the Theory Swingtum of intelligent finance. We gauge the crypto market’s breadth and direction by showing charts 2100NEWS Digital Assets Total Index (NWST1100), which measures 1100 (by market capitalization) significant crypto assets’ performance. The information-laden chart is complex to read initially, but the graph shows essential price information, crucial decisive price levels, momentum, trading volumes, and crypto market breadth. Monitoring Market Sentiment and Breadth is necessary to detect early signs of trend reversals or continued strength.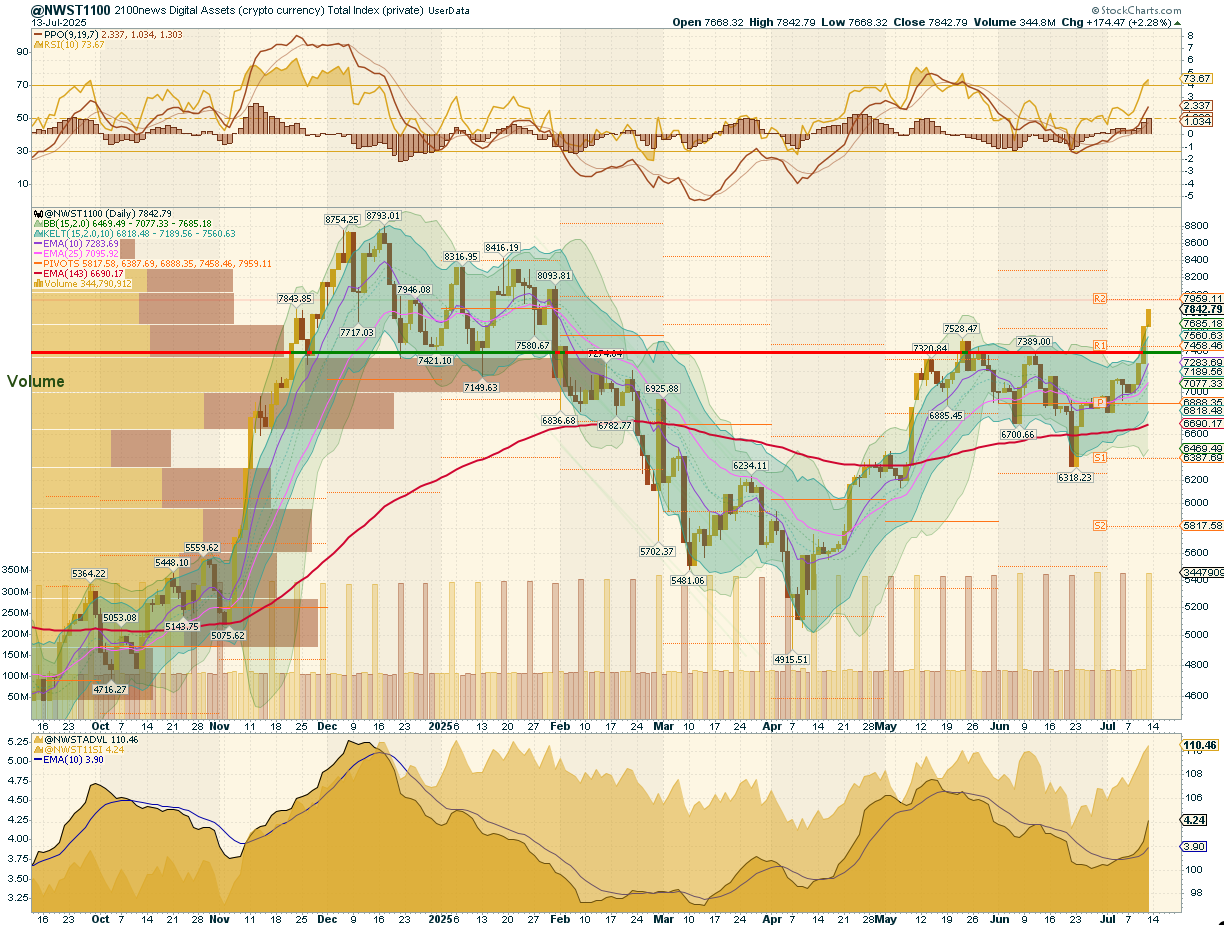
After conducting a detailed examination of the NWST1100 chart, a vital metric for the cryptocurrency market, reveals several essential market dynamics and changes in market sentiment:
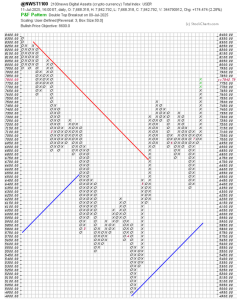
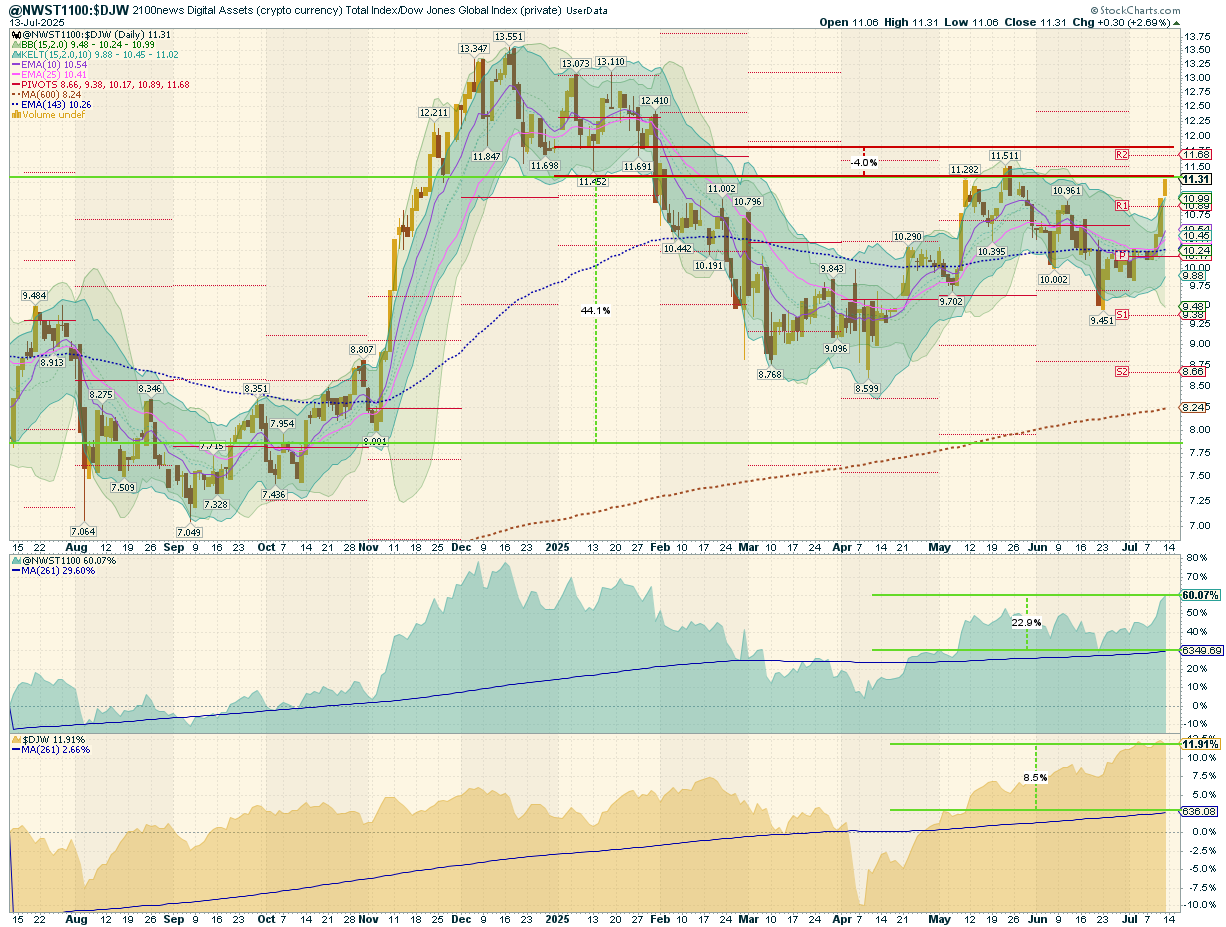
The NWST1100: After a staged recovery two weeks ago into the area between the 10-day and 25-day EMAs, the NWST1100 confirmed a bullish golden cross and tested support before launching into a decisive rally. The index broke through key resistance and closed the week at its highest level in months, up 11.71%, confirming a Double Top Breakout on the Point & Figure chart with a bullish target of ~8,600. This breakout reflects improving sentiment, broadening participation, and rising momentum, lifting the market decisively out of its multi-week range.
Market Sentiment (PPO & RSI): The PPO histogram crossed into positive territory, confirming the shift in momentum. The PPO has turned upward decisively. Meanwhile, the RSI has climbed above 60, signaling renewed bullish pressure and validating the breakout above resistance.
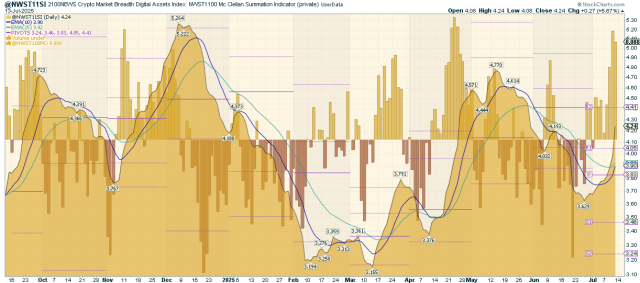
Crypto Market Breadth indicators at the bottom of the chart accelerated higher in tandem, confirming widespread participation and strengthening momentum. The McClellan Summation Index rallied sharply in a parabolic fashion, and the Advance-Decline Line (ADL) also surged, highlighting a significant rise in advancing assets relative to decliners.
In summary, the crypto market decisively broke out of its prior range, delivering the strongest week in months. Technicals, breadth, and sentiment have all turned bullish, and the confirmation of a double-top breakout suggests further upside potential, with targets around 8,600. Investors should remain aware of potential short-term overbought conditions, but can take confidence in the structural improvement across segments.
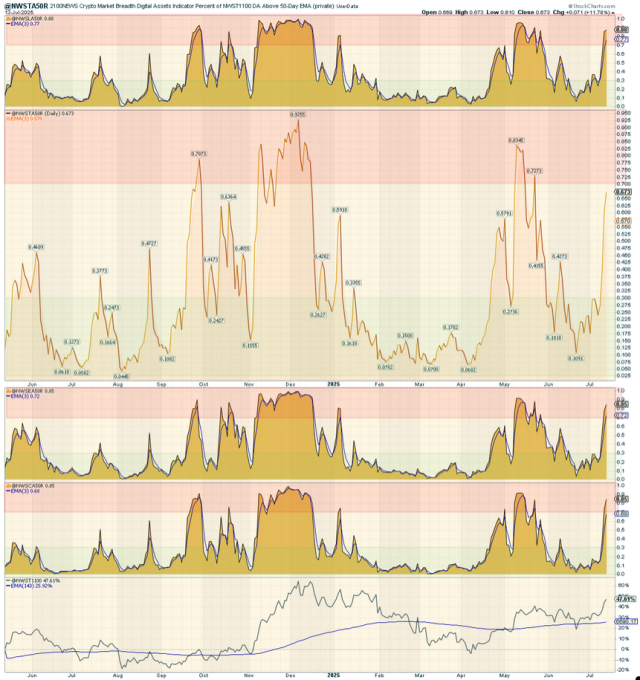
According to the chart on the right, A50R indicators across all four market segments (NWST1100, NWSET100, NWSL100, NWSCo100) climbed above 0.6 across major segments, reflecting a broadening participation in the rally. This breadth indicator measures the percentage of digital assets trading above a 50-day moving average.
* The percentage of digital assets trading above a specific moving average is a breadth indicator that measures internal strength or weakness in the underlying index. The chart on the right side compares the percentage of DA trading above the 50-day EMA for:
- 100 Large-caps members of NWSL100 (top box)
- 1100 members of NWST1100
- 100 Ethereum Tokens members of NWSET100
- 100 Coins members of NWSCo100 (bottom box)
Outlook for this week
This report delves into the cryptocurrency market’s short-term outlook, identifying patterns and signals that could provide insights into potential market direction. While predicting market behavior is inherently uncertain, discernible trends in momentum and market breadth indicators suggest possible developments.
-
The PPO histogram, which reflects the rhythm and rate of change in market momentum, has continued rising but may begin to flatten or inflect downward mid-to-late week as the PPO lines approach historical highs seen in May and December, signaling a potential peak.
-
The RSI (Relative Strength Index) is currently at 74, firmly in overbought territory, yet still climbing with an upward slope. These elevated levels confirm broad-based strength and trend continuation for now, but also warn of potential exhaustion if no new catalysts emerge.
- The Breadth indicators at the bottom of the first chart (NWST1100): ADVL and the McClellan Summation Index on the chart below have also accelerated higher, confirming a wide-participation rally. While their upward trajectory remains intact, their rapid ascent could also be a precursor to an inflection point, consistent with an overheated market, which might manifest in the coming sessions.
In conclusion, the upcoming Crypto Week (July 14–18, 2025) in the U.S. House of Representatives — focused on the GENIUS Act, CLARITY Act, and Anti-CBDC Surveillance State Act — provides strong short-term support for the ongoing parabolic rally. This momentum has already driven Bitcoin to new record highs and propelled the NWST1100 toward its bullish price objective of ~8,600. However, historical patterns and current technicals suggest that the rally could overshoot beyond the Pivot R2 level before a sharp retracement sets in. Once this parabolic phase ends, a pullback toward the 0.78 Fibonacci retracement, roughly 5% below the peak (near or just above Pivot R2 at ~8,000), is probable. Over the longer term, these legislative initiatives could lay a solid foundation for the crypto market’s structural growth. Still, the current rally itself is unlikely to sustain its steep trajectory indefinitely. Investors should remain cautious, watching closely for signs of a breakout, a reversal, or a transition to range-bound behavior, and recognize that while the regulatory progress is constructive for the market, it does not necessarily underpin this specific rally phase.
📍 Key levels to watch:
Resistance: 8600 (Point & Figure chart, bullish price objective)
Support: 7,950 (Pivot R2 upper resistance zone potential flip to support)
7,450 (horizontal resistance line turned to support)
Performance of different groups of Digital Assets (Coins and Tokens)
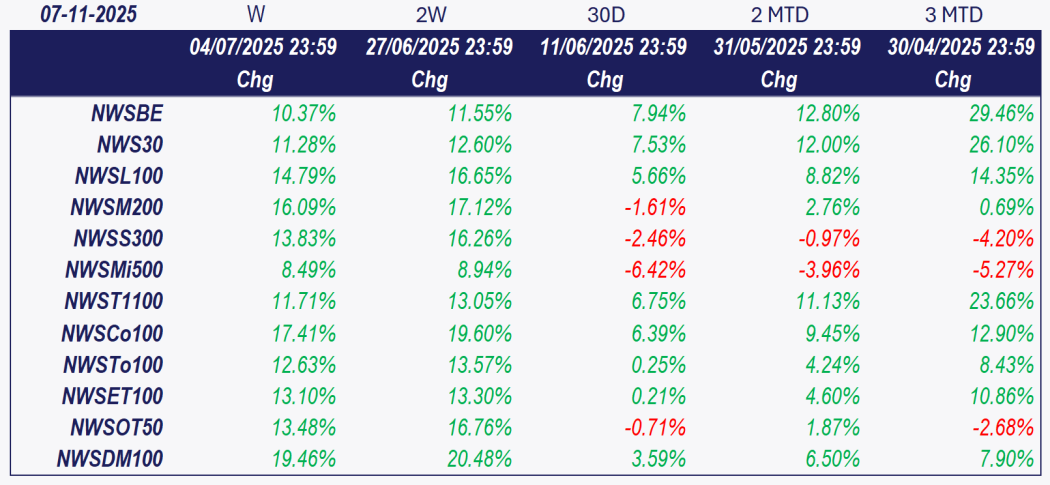
Investors and traders often rely on historical performance data to make informed decisions about their cryptocurrency holdings. After analyzing the data in the table, it can be seen that the crypto market rallied, and the overall index has soared 11.71% over the last week. 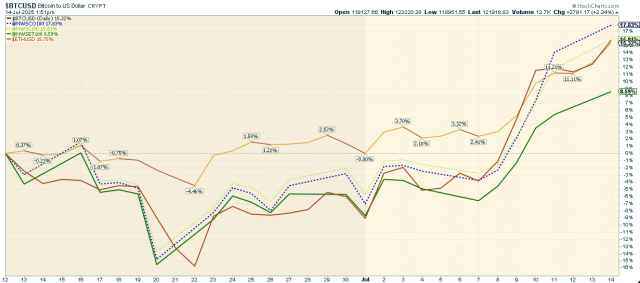 The chart above highlights the performance of various cryptocurrencies, such as Bitcoin, Ether, and the 2100NEWS Indices, which represent the performance of Ethereum-based tokens (NWSET100), Large caps (NWSL100), and Coins (NWSCo100). Coins represented by (NWSCo100) held up better than other segments and have slightly outperformed other segments, surging by 17.83% in the previous thirty days.
While the broader market has rallied, different segments and individual cryptocurrencies exhibit different performance dynamics.
Performance Trends by Market Segment:
✔ Ether led the market,
✔ NWSBE, Bitcoin, and NWS30 weakened, indicating declining strength.
✔ NWSET100 (Ethereum-based tokens), NWSCo100 (Coins), and NWSL100 (Large Caps) improved.
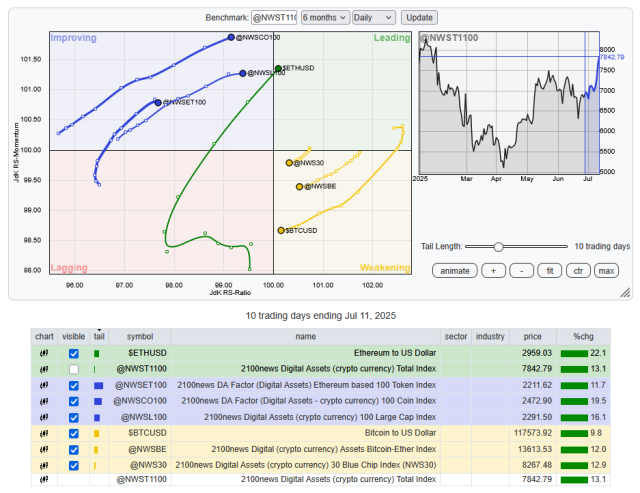
Investors and traders might use this information to adjust their portfolios, possibly shifting focus toward assets with stronger relative momentum while being cautious about those in the Weakening quadrant.
*RRG® charts show the relative strength and momentum of groups of digital assets. Those with strong relative strength and momentum appear in the green Leading quadrant. As relative momentum fades, they typically move into the yellow Weakening quadrant. If relative strength then fades, they move into the red Lagging quadrant. Finally, when momentum picks up again, they shift into the blue Improving quadrant.
Crypto (Digital Assets) compared with global equity
This report offers a comprehensive analysis comparing the performance of digital assets, as signified by the NWST1100 index, to shares on global capital markets, as represented by the Dow Jones Global W1Dow index. The comparison spans various timeframes, offering insights into historical and recent performances and potential future trends.
Let’s break down the key observations and implications:
- Historical Performance Comparison:
- 44 Months Ago: Digital assets showcased a notable outperformance against shares in global capital markets, reaching a record high in the comparative quotient between the NWST1100 and W1Dow indexes. At this juncture, digital assets displayed a notably superior performance trajectory compared to shares on global capital markets.
- Over the past twelve months, digital assets have outperformed equities by 44.1%.
- Mean Reversion Opportunity:
- Over the past 143 working days, the average quotient price, represented by a blue dashed curve, stands at 10.26, while the current spot ratio is 11.31. This is higher than the long-term mean of 8.24, which has increased since October.
- The mean reversion theory suggests that asset prices tend to revert to their historical average returns over time. The current average quotient price above the long-run mean could imply that digital assets are still trading at a relative premium to historical trends.
- Returns Comparison:
- The chart also presents the returns achieved by the simplified index-based accumulation approach—buying one index point per day over 12 months—to simulate a mechanical exposure build-up. While this method is not equivalent to classical dollar-cost averaging (which involves investing a fixed amount of capital daily), it offers a consistent benchmark to compare historical costs and returns. The NWST1100 Crypto Index has risen by 60.07% from twelve months ago. With daily index investments, an investor’s stock price would have resulted in a gain of 22.9% on the current index price, reflecting unprofitable purchases due to high entry prices during a prolonged market uptrend when prices remained above the 143-day moving average for an extended period.
- The DJW, representing global capital market shares, has risen 11.91% over the past twelve months. However, a strategy involving daily purchases would have resulted in a gain of 8.5%.
- Conclusion:
*The box in the middle of the chart shows the original NWST1100 price; at the bottom is W1Dow.
 Litecoin