


2100NEWS WEEKLY CRYPTO REPORT Sep-1

The NWST1100 index has declined by 1.63% from the previous week. Over the last thirty days, Ehter has exhibited the most favorable performance. However, this performance has still decreased by 11.26%.
*Below, we present a standardized weekly report and next week’s outlook, prepared based on the Theory Swingtum of intelligent finance. We gauge the crypto market’s breadth and direction by showing charts 2100NEWS Digital Assets Total Index (NWST1100), which measures 1100 (by market capitalization) significant crypto assets’ performance. The information-laden chart is difficult to read initially, but the graph shows essential price information, crucial decisive price levels, momentum, trading volumes, and crypto market breadth.
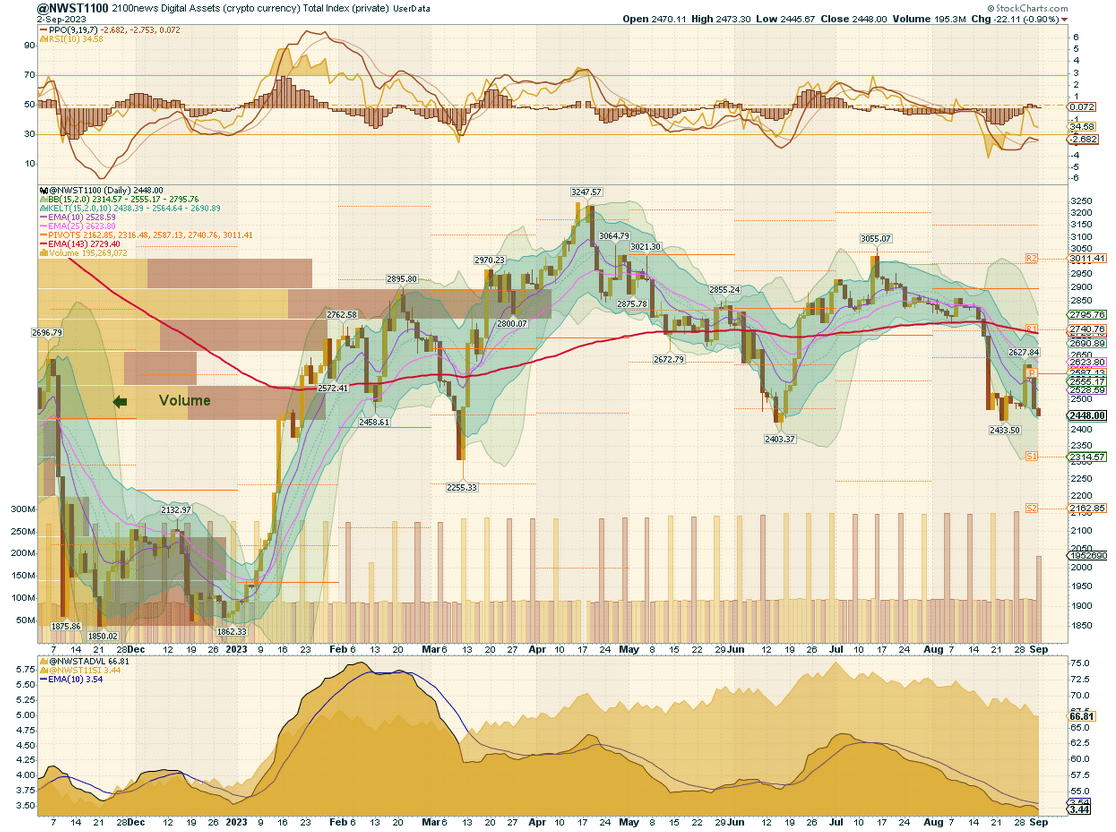
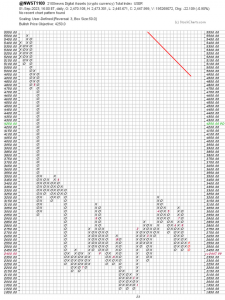
As we predicted in our previous report, the cryptocurrency market experienced a temporary increase towards the end of the month. We have analyzed the NWST1100 index chart, which serves as a significant benchmark index, and discovered several important details:
- The NWST1100 index price exhibited a significant relief rally during the week, particularly on Tuesday. This surge was characterized by a substantial increase in index value. The impetus behind this rally can be attributed to Grayscale’s successful outcome in a lawsuit against the U.S. Securities and Exchange Commission (SEC). This legal victory granted Grayscale the green light to introduce the first-ever Bitcoin exchange-traded fund (ETF) in the United States. However, prices retraced throughout the week, ultimately resulting in a weekly loss for the index.
- Market Sentiment: The Percentage Price Oscillator (PPO) lines began to rise. However, it is essential to note that the PPO histogram displayed a subsequent decline after Tuesday’s rally. Additionally, the Relative Strength Index (RSI) had an inconsistent trajectory, making the prevailing sentiment dynamics more complex.
- Crypto Market Breadth indicators: The observations on the Crypto Market Breadth indicators at the bottom of the chart reveal a decrease in market breadth. The ADVL (Advance-Decline Line) falling suggests that there are more declining digital assets than advancing ones, indicating a bearish breadth in the market. Furthermore, the McClellan Summation Index experienced a drop, further affirming the negative breadth and supporting the prevailing bearish sentiment.
Considering these comprehensive observations, it is evident that a sense of volatility and uncertainty marks the current sentiment within the cryptocurrency market. The relief rally was followed by a price retracement, and market breadth is decreasing. These factors contribute to the ambiguous nature of the present cryptocurrency market sentiment.
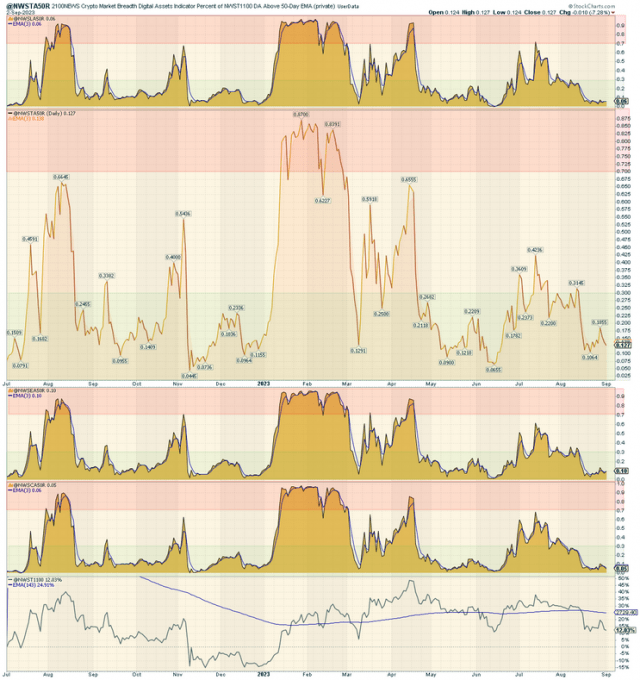
The chart on the right shows that all four A50R lines are currently oversold. This breadth indicator measures the percentage of digital assets trading above a 50-day moving average. An oversold condition indicates that many cryptocurrencies are trading below their 50-day EMA (at relatively low levels compared to their short-term moving averages). As a result, some market participants may see this as an opportunity to buy at potentially discounted prices. In contrast, others may approach it cautiously, considering the overall negative sentiment in the market.
* The percentage of digital assets trading above a specific moving average is a breadth indicator that measures internal strength or weakness in the underlying index. The chart on the right side compares the percentage of DA trading above 50 days EMA for:
- 100 Large-caps members of NWSL100 (top box)
- 1100 members of NWST1100
- 100 Ethereum Tokens members of NWSET100
- 100 Coins members of NWSCo100 (bottom box)
Outlook for this week
This crypto report aims to provide an analysis of the near-term market outlook for the cryptocurrency market. While complete predictability remains challenging, the market waves show some degree of predictability with discernible patterns in market behavior. By examining momentum indicators, several signals emerge that offer insights into the potential direction of the market in the short term.
- The RSI (Relative Strength Index) currently stands at 35, indicating a moderate level of selling pressure in the market. This RSI reading offers insights into the equilibrium between buying and selling forces.
- The Percentage Price Oscillator (PPO) histogram appears poised for a potential upturn. A rising PPO histogram can signal a strengthening momentum, suggesting the possibility of an evolving trend. The PPO, a momentum indicator tracking the percentage difference between two moving averages, may continue its ascent.
- Delving into the breadth indicators at the bottom of the NWST1100 chart, there are indications of a potential shift in direction. The McClellan Summation Index, a long-term market breadth indicator reliant on the McClellan Oscillator, has been illustrating a consistent decline in market breadth. When the oscillator bars dip below zero, it implies a bearish momentum, signifying that the current market breadth favors declining assets.
Considering the current market landscape and this analytical setup, the cryptocurrency markets are poised to persist in a sideways drift in the upcoming week, especially in the absence of notably positive news catalysts. The absence of substantial positive developments, coupled with the current low market levels and the recent rally’s lack of follow-through, reinforces the notion that a significant bullish rally may not be imminent unless there is a notable shift in market dynamics.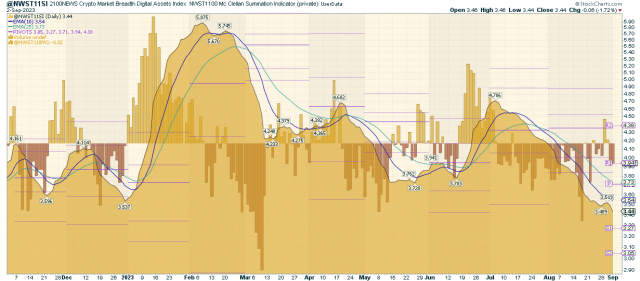
Performance of different groups of Digital Assets (Coins and Tokens)
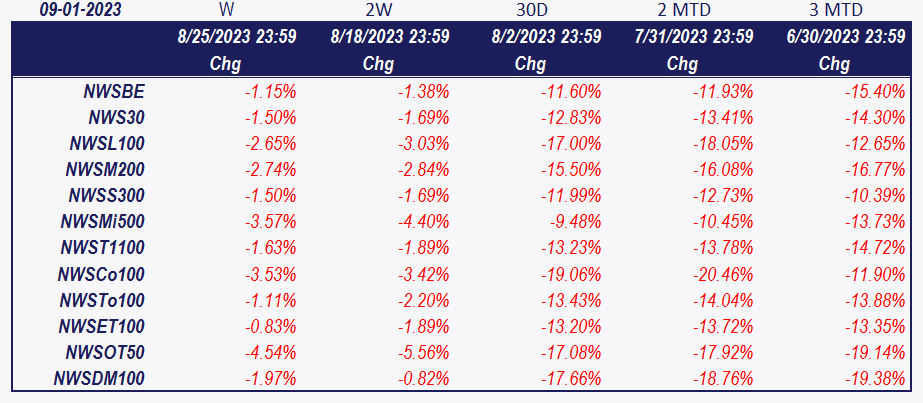
After analyzing the data in the table, the overall index NWST1100 has declined by 1.63% over the past week. 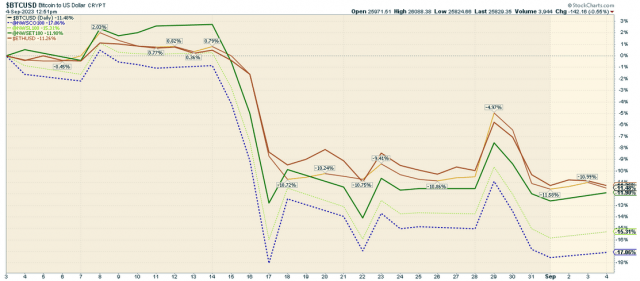 The chart below highlights the performance of various cryptocurrencies, such as Bitcoin, Ether, and the 2100NEWS Indices, which represent the performance of Ethereum-based tokens (NWSET100), Large caps (NWSL100), and Coins (NWSCo100). A retrospective view over the last thirty days indicates that Ether has exhibited the most favorable performance. However, this performance has still decreased by 11.26% over this period.
Crypto (Digital Assets) compared with global equity
These comparisons provide insights into the relative performance of digital assets and traditional stocks over different periods.
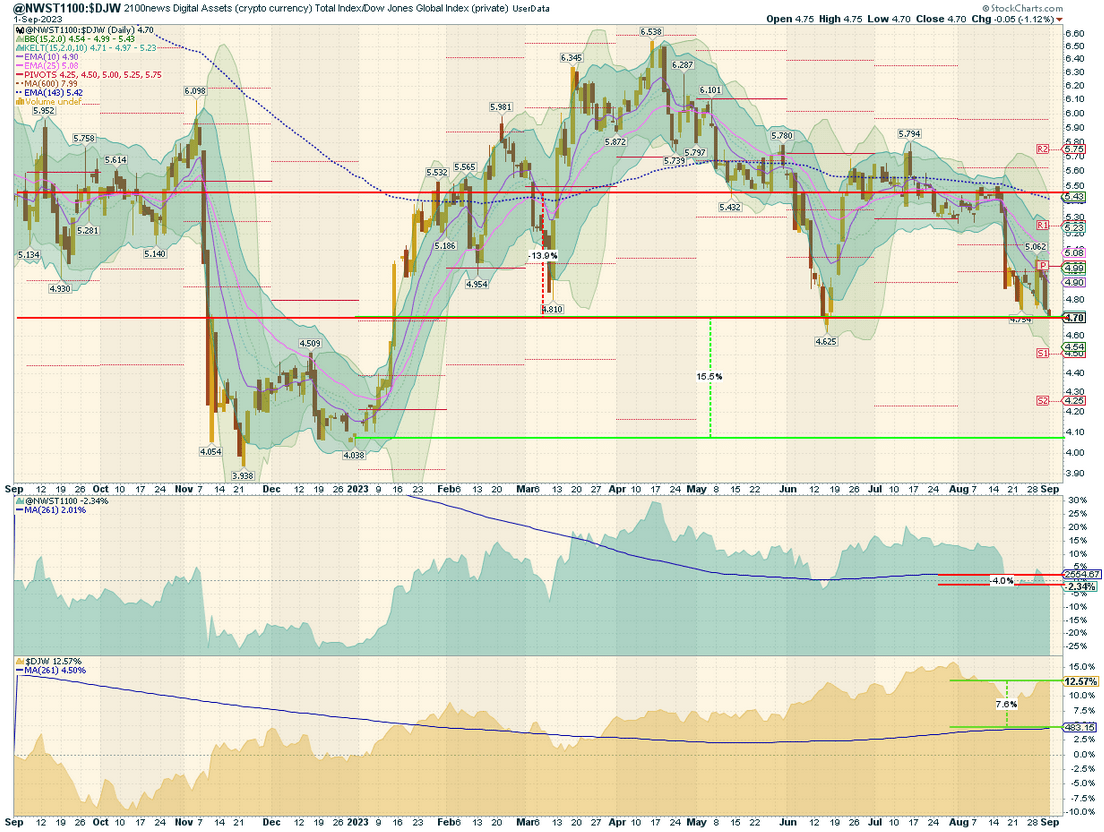
This comparison provides insights into the performance differences between digital assets (coins, tokens) and traditional stock. The NWST1100 represents digital assets, while the Dow Jones Global W1Dow index represents traditional stocks. Let’s break down the key observations and implications:
- Historical Performance Comparison:
- 22 Months Ago: Digital assets, represented by the NWST1100 index, were outperforming traditional stocks, represented by the W1Dow index, with a record high quotient between the two indexes. This suggests that investing in digital assets was more profitable during that period compared to traditional stocks.
- 12 Months Ago: However, over the past 12 months, digital assets have lagged behind traditional stocks by 13.9%. This indicates that traditional stocks have delivered better returns than digital assets during this specific time frame.
- Recent Shift in Performance:
- In the current year, there has been a noticeable shift in performance, with digital assets outperforming traditional stocks by a margin of 15.5%. This suggests a potential resurgence in the performance of digital assets and a change in investor sentiment toward the cryptocurrency market.
- Mean Reversion Opportunity:
- The chart includes a blue dashed curve representing the average quotient price over 143 working days. This average has been lower than the long-run mean at 7.99. This observation hints at a potential buying opportunity for digital assets based on the mean reversion theory.
- The mean reversion theory suggests that asset prices, over time, tend to revert to their historical average returns. The fact that the current average quotient price is below the long-run mean could imply that digital assets are currently undervalued compared to historical trends.
- Returns Comparison:
- The chart also presents the returns achieved with the stock price generated by buying one point of the respective index daily over the past twelve months.
- The NWST1100 Crypto Index experienced a 2.34% loss compared to a year ago. Additionally, the purchased stock of the index achieved a 4.0% decrease compared to the index’s current price.
- In contrast, the DJW Capital Index (traditional stocks) experienced a 12.57% gain compared to a year ago. It achieved a 7.6% return on the purchased stock of the index based on daily purchases.
*The box in the middle of the chart shows the original NWST1100 price; at the bottom is W1Dow.
 Lily
Lily Litecoin