


2100NEWS WEEKLY CRYPTO REPORT Apr-3

The crypto index NWST1100 increased 1.08% last week. However, the gain masks a structurally fragile market characterized by repeated rebounds, shallow breakout attempts, and rapid reversals rather than sustained continuation. Over the past 30 days, Ether emerged as the strongest relative performer, posting a 1.90% gain.
*Below, we present a standardized weekly report and next week’s outlook, prepared based on the Theory Swingtum of intelligent finance. We gauge the crypto market’s breadth and direction by showing the 2100NEWS Digital Assets Total Index (NWST1100), which measures the performance of 1100 (by market capitalization) significant crypto assets. The information-laden chart is initially complex to read, but it effectively displays essential price information, key decision-making levels, momentum, trading volumes, and crypto market breadth. Monitoring Market Sentiment and Breadth is necessary to detect early signs of trend reversals or continued strength.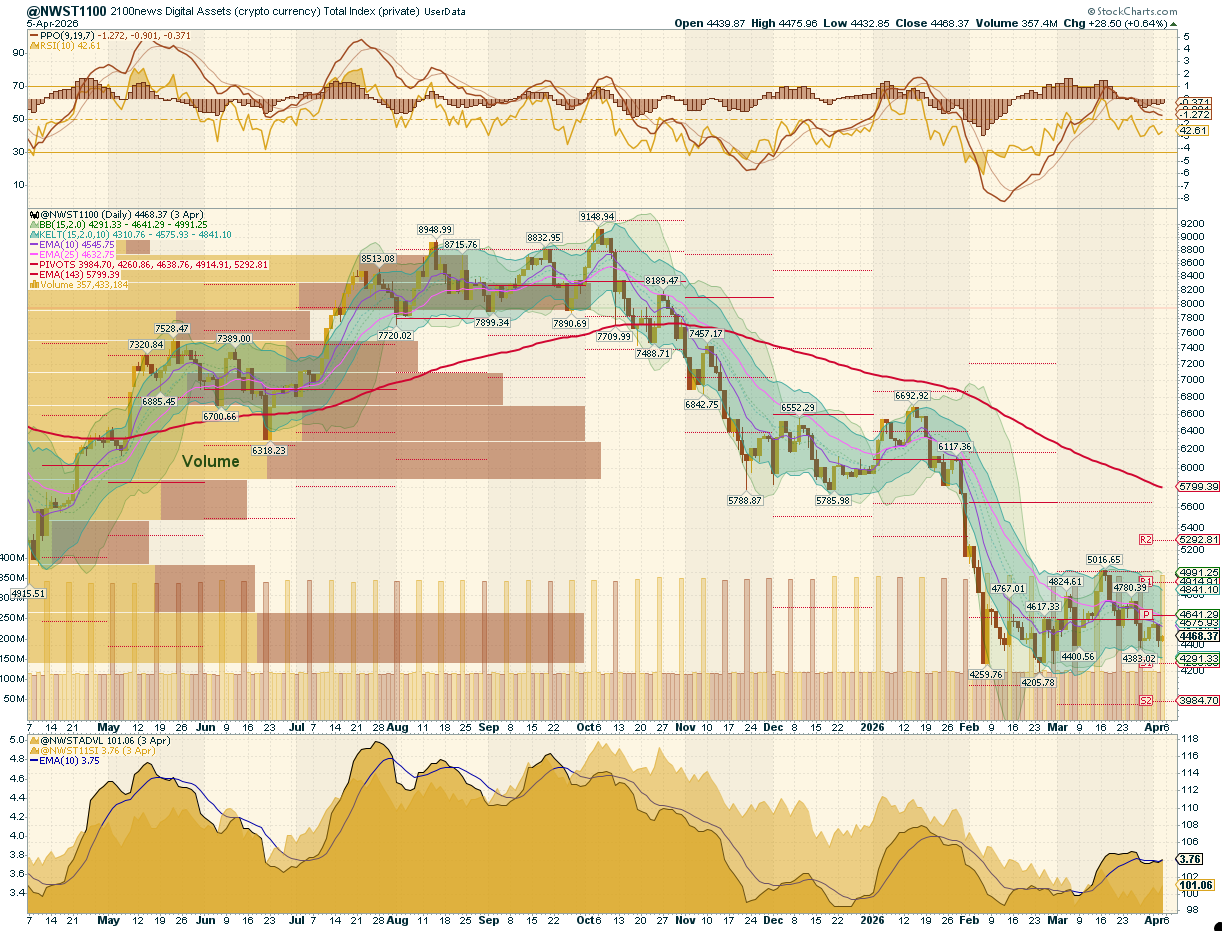
After conducting a detailed examination of the NWST1100 chart, a vital metric for the cryptocurrency market, several essential market dynamics and changes in market sentiment are revealed:
The NWST1100 index gained 1.08% over the past week, but this modest increase masks a market that remained structurally indecisive and tactically unstable. Following the late-March capitulation phase, digital assets transitioned into a repair regime marked by repeated rebounds, shallow breakout attempts, and rapid reversals. While price action improved sufficiently to avoid a renewed breakdown, it failed to generate the sustained follow-through required to confirm a durable upside transition. From a structural perspective, the market remained confined within a well-defined 4,300–4,900 repair range. Several sessions—most notably around March 30 and April 1—displayed constructive rebound dynamics, with the index attempting to extend higher within the channel. However, each advance stalled below the upper resistance zone and was swiftly rejected. The sharp pullback on April 2 reinforced the fragility of the recovery and confirmed that supply remains active near resistance. In essence, the market has exited panic conditions but has not yet entered expansion. It continues to oscillate within a repair corridor, where rallies require confirmation and failed breakouts remain a defining feature.
Market Sentiment (PPO & RSI): Momentum indicators convey a consistent message. PPO lines remain below zero, confirming that the higher-timeframe trend is still structurally bearish, while the PPO histogram has rolled back into negative territory, signaling that the positive momentum wave from the prior rebound has already faded and that the market has entered the lower half of the short-term momentum cycle. The RSI ended near 43, which is neither oversold nor strong enough to suggest trend expansion. This is consistent with a market that has shifted from rebound into support-testing behavior rather than renewed upside acceleration.
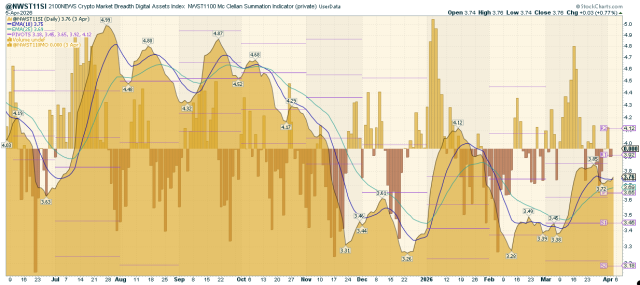
Crypto Market Breadth indicators: A mixed but ultimately cautious picture. The Advance-Decline Volume Line (ADVL), adapted by 2100News for the crypto market as ADVPL, tracks the net money volume of advancing versus declining digital assets. It improved from the March lows but weakened again by the end of the period, indicating that participation behind the recovery remained inconsistent. The McClellan Summation Index, a long-term breadth measure derived from the McClellan Oscillator, flattened after its rebound attempt and began to soften, which is consistent with internal stabilization losing momentum rather than broadening into a healthier advance. In short, capital stopped fleeing in panic, but it has not returned in a committed, market-wide way.
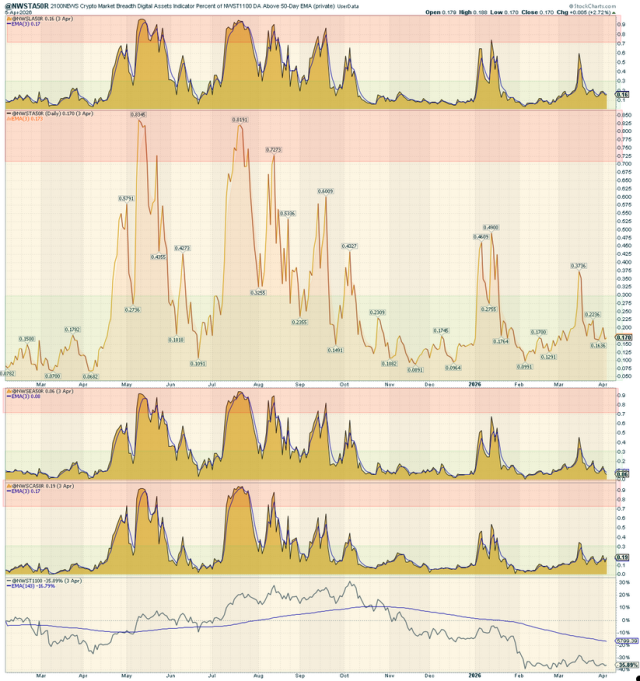
A50R Participation: According to the chart on the right, all A50R indicators across the major segments (NWST1100, NWSET100, NWSL100, NWSCo100) show thin participation. A50R readings — the share of assets trading above their 50-day EMAs — stayed low, ending in the 6% to 19% range, confirming that the broader market is still operating in a damaged regime. The Ethereum Tokens (NWSET100) cohort remains the weakest. Coins and the total market stabilized somewhat better than the weaker segments, but the internal picture remains far from robust. This still looks like a repair inside a damaged structure, not a clean bull-phase transition.
This breadth indicator measures the percentage of digital assets trading above a 50-day moving average.
* The percentage of digital assets trading above a specific moving average is a breadth indicator that measures internal strength or weakness in the underlying index. The chart on the right side compares the percentage of DA trading above the 50-day EMA for:
- Top panel: NWSL100 (Large Caps)
- Middle panel: NWST1100 (Total Market)
- Third panel: NWSET100 (Ethereum-based tokens)
- Bottom panel: NWSCo100 (Coins)
📉 Summary
The week of March 28 to April 3 was defined by repair without confirmation. The market continued to recover from the prior capitulation phase, but every upside attempt remained vulnerable to reversal. Momentum has already turned back down on the short-term cycle, breadth has stopped improving, and internal participation remains limited. The market is no longer in free fall, but it is also not in a sustainable uptrend. This remains a fragile range-bound repair environment, where rallies should still be treated tactically and only confirmed breakouts deserve conviction.
Outlook for this week
This report examines the cryptocurrency market’s short-term outlook, identifying patterns and signals that may offer insights into potential market direction. While predicting market behavior is inherently uncertain, discernible trends in momentum and market breadth indicators suggest possible developments.
- From a structural standpoint, the market remains within the established range, but internal dynamics have shifted from downside completion to early re-acceleration, not into a fresh support-testing phase. Instead, price is consolidating above the mid-range support zone, suggesting that the broader repair process remains intact, rather than transitioning back into a directional decline.
- The RSI (Relative Strength Index) stood at 43 last week, reflecting a market that has stabilized after a corrective phase and is now positioned for a gradual recovery rather than further immediate downside pressure.
- The PPO histogram, which measures the rate of change (i.e., the first derivative) of the PPO lines, is now approaching the zero line. The negative leg of the cycle has already completed. A less likely scenario is that the PPO histogram is rejected at or just below the zero line, preventing full momentum rotation. Since the histogram represents the rate of change of PPO lines, PPO lines are transitioning toward an upward inflection, likely to materialize during the coming week.
- The Breadth indicators at the bottom of the first chart (NWST1100) have turned higher. The ADVPL may continue mild accumulation. At the same time, the McClellan Summation Index may begin rising, indicating that capital is re-entering the market and that internal participation is expanding again.
- Taken together, momentum and breadth are now aligned on the upside. Under normal conditions, this configuration suggests that the market will continue drifting higher toward the Pivot (P) level and attempt to reclaim it, with a high probability of continuation above it if breadth expansion persists.
📌 Target and Scenario Considerations:
Most likely scenario:
📍 Key Levels to Watch:
-
Support: 4,450–4,350 (range support/volatility envelope base)
-
Resistance: 4,800 (0.236 Fibonacci threshold / failed breakout ceiling)
Performance of different groups of Digital Assets (Coins and Tokens)
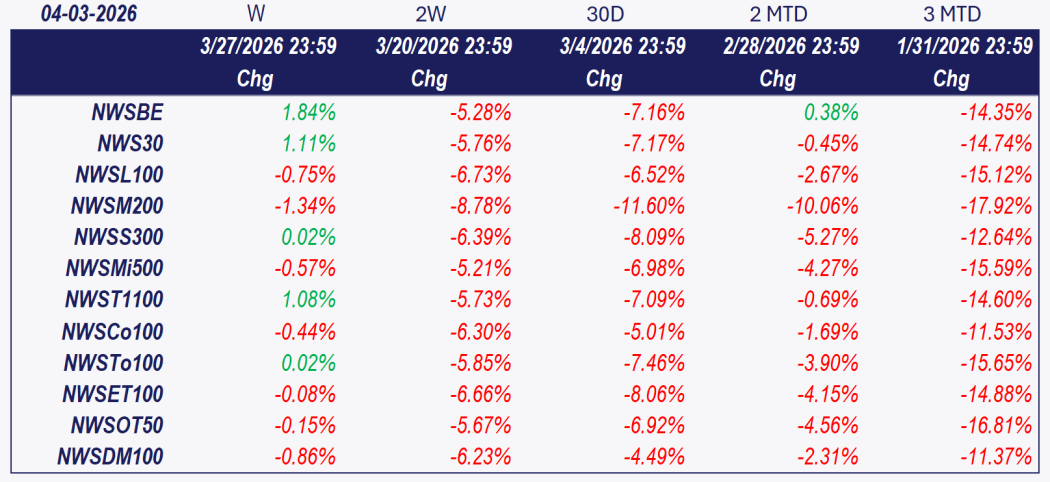
Investors and traders rely on historical performance data to contextualize short-term moves and assess the relative strength of different market segments. The latest table shows a rise across half categories, with the NWST1100 index rose 1.08% over the past week. 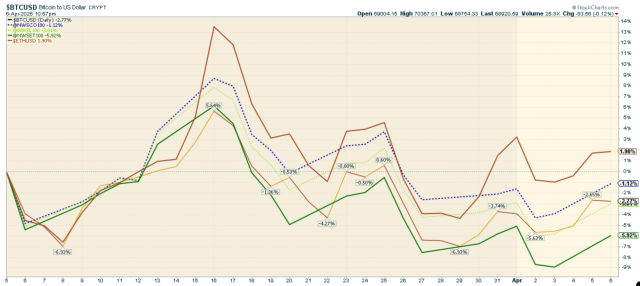 The chart above highlights the performance of various cryptocurrencies, including Bitcoin, Ether, and the 2100NEWS Indices, which represent Ethereum-based tokens (NWSET100), large caps (NWSL100), and Coins (NWSCo100). Over the past 30 days, Ether emerged as the strongest relative performer, posting a 1.90% gain.
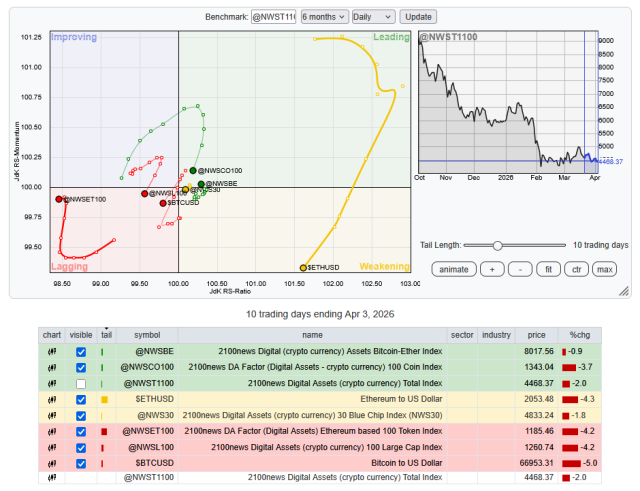
While the broader market has increased, different segments and individual cryptocurrencies exhibit distinct performance dynamics.
Performance Trends by Market Segment:
✔ NWSCo100 (Coins)and NWSBE led the market,
✔ Ether and NWS30 have been weakening.
✔ Bitcoin, NWSET100 (Ethereum-based tokens) and NWSL100 (Large Caps) lagged.
Investors and traders might use this information to adjust their portfolios, possibly shifting focus toward assets with stronger relative momentum while being cautious about those in the Weakening quadrant.
*RRG® charts show the relative strength and momentum of groups of digital assets. Those with strong relative strength and momentum appear in the green Leading quadrant. As relative momentum fades, they typically move into the yellow Weakening quadrant. If relative strength then fades, they move into the red Lagging quadrant. Finally, when momentum picks up again, they shift into the blue Improving quadrant.
Crypto (Digital Assets) compared with global equity
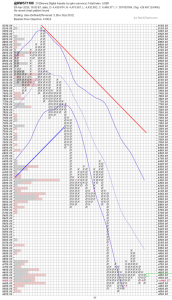
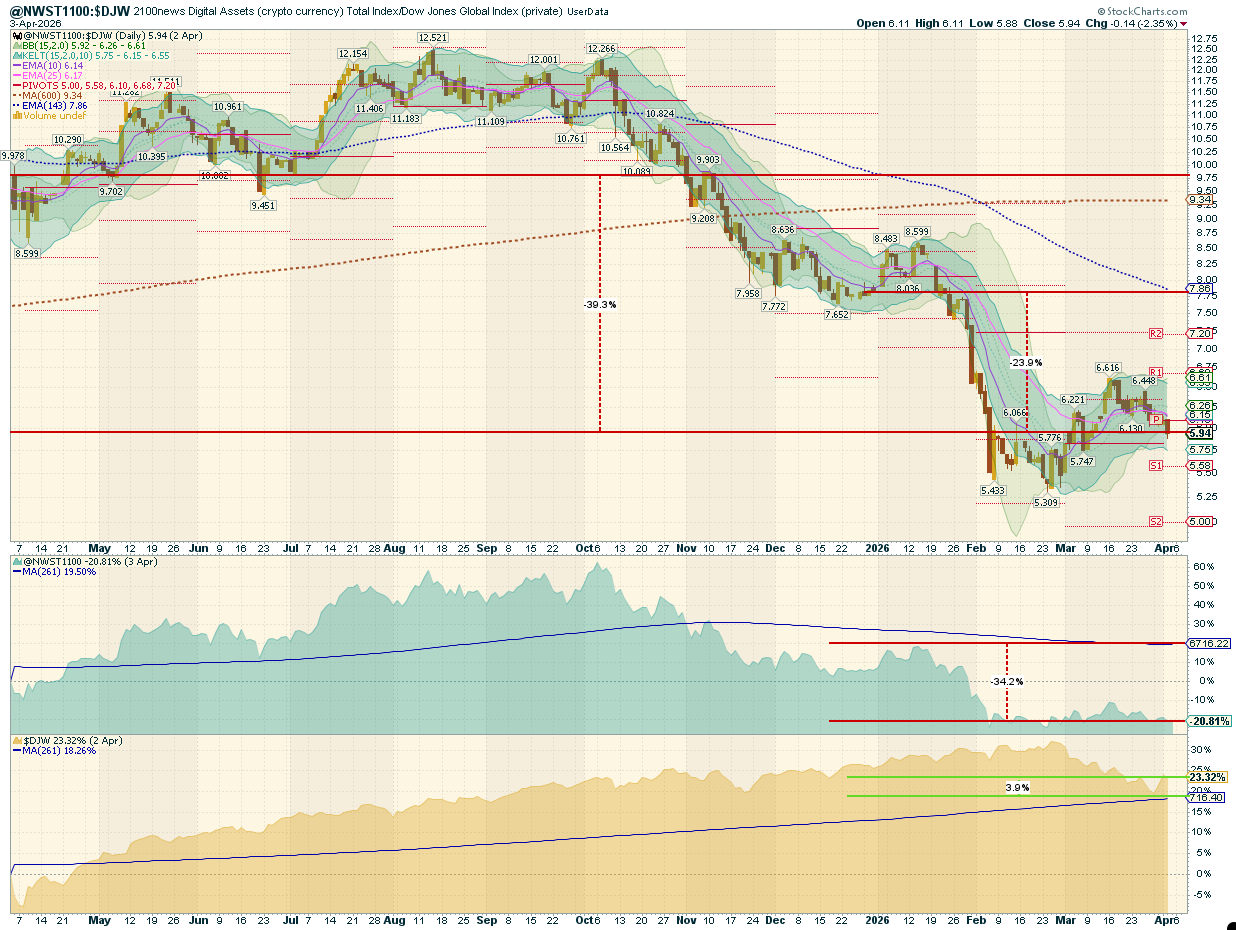
This report offers a comprehensive analysis comparing the performance of digital assets, as measured by the NWST1100 index, to that of shares on global capital markets, as represented by the Dow Jones Global W1Dow index. The comparison spans multiple timeframes, providing insights into historical and recent performances and potential future trends.
Let’s break down the key observations and implications:
- Historical Performance Comparison:
- 53 Months Ago: Digital assets vastly outperformed global equities in global capital markets, reaching a record high in the comparative quotient between the NWST1100 and W1Dow indexes. At this juncture, digital assets displayed a notably superior performance trajectory compared to shares on global capital markets.
- Over the past twelve months, digital assets have underperformed equities by 39.3%.
- Mean Reversion Opportunity:
- Over the past 143 working days, the average quotient price, represented by the blue-dashed curve, stands at 7.86, while the current spot ratio is 5.94, which is lower than the long-term mean of 9.34, which has increased since October 2024.
- The mean-reversion theory posits that asset prices tend to revert to their historical average returns over time. The current NWST1100-to-DJW price ratio, which is below the long-run mean, may indicate that digital assets are undervalued relative to historical trends.
- Returns Comparison:
- The chart also presents the returns achieved by the simplified index-based accumulation approach—buying one index point per day over 12 months—to simulate the mechanical accumulation of exposure. While this method is not equivalent to classical dollar-cost averaging (which involves investing a fixed amount of capital daily), it provides a consistent benchmark for comparing historical costs and returns. The NWST1100 Crypto Index has dropped by 20.81% over the past twelve months. With daily index investments, an investor’s stock price would have resulted in a 34.2% loss from the current index price, due to unprofitable purchases at high entry prices during a prolonged market uptrend, when prices remained above the 143-day moving average for an extended period.
- The DJW, a broad-based global equity index, has risen 23.32% over the past 12 months. However, a daily-purchase strategy would have yielded a 3.9% gain.
- Conclusion:
*The box in the middle of the chart shows the original NWST1100 price; at the bottom is W1Dow.


 Litecoin