


2100NEWS WEEKLY CRYPTO REPORT May-22

The NWST1100 index declined 3.88% last week; Venice Token (VVV), a large-cap Non-Ethereum-based Token, has made the most significant leap in rank within the NWSL100 crypto index over the past two weeks.
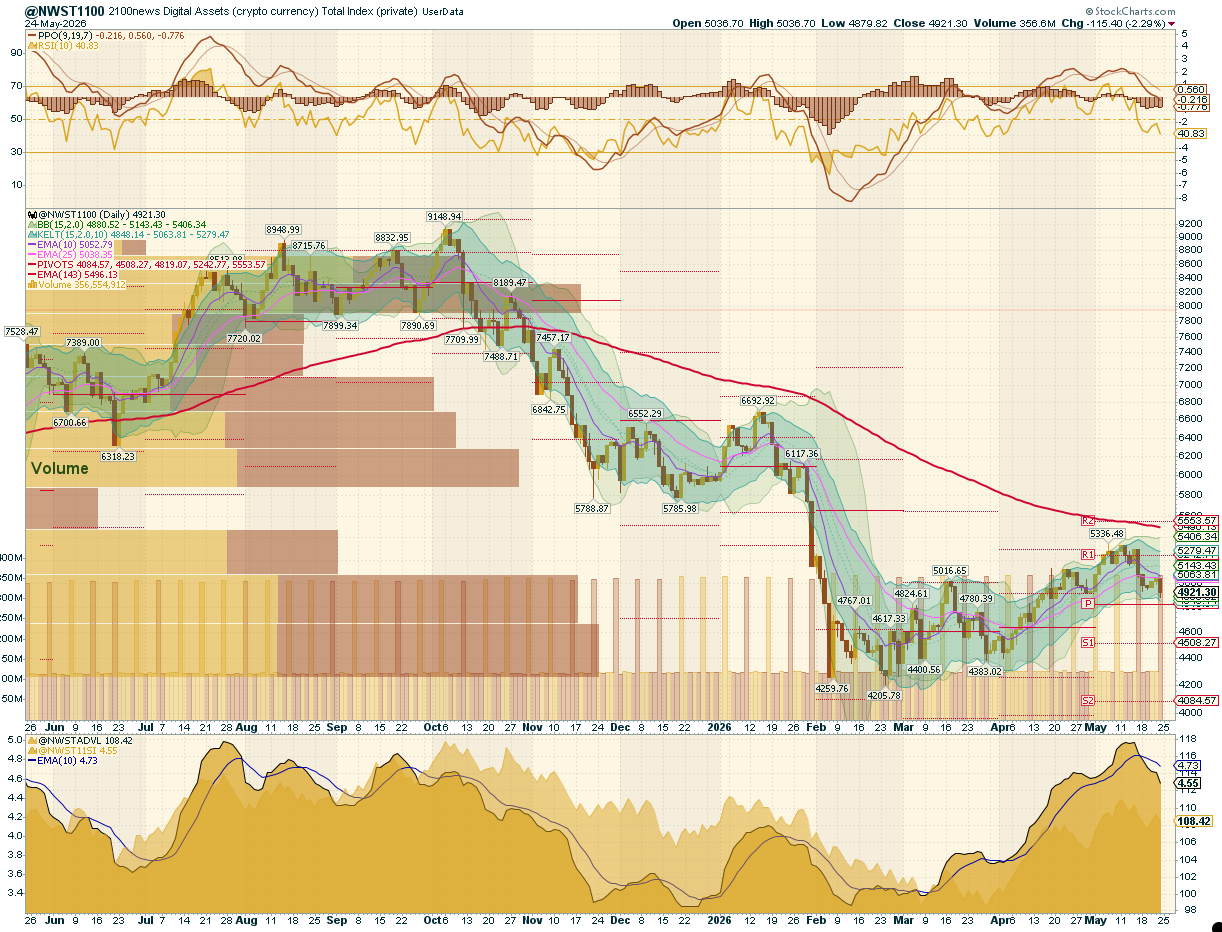
*Below, we present a standardized weekly report and next week’s outlook, prepared based on the Theory Swingtum of intelligent finance. We gauge the crypto market’s breadth and direction by showing the 2100NEWS Digital Assets Total Index (NWST1100), which measures the performance of 1100 (by market capitalization) significant crypto assets. The information-dense chart is initially complex to read, but it clearly displays essential price information, key decision-making levels, momentum, trading volumes, and crypto market breadth. Monitoring Market Sentiment and Breadth is necessary to detect early signs of trend reversals or continued strength.
Our detailed analysis of the NWST1100 chart and related market indicators reveals essential insights into the current market conditions:
The NWST1100 index declined 3.88% over the last week, trading within a clearly defined lower range after the previous recovery impulse had already failed to clear higher resistance. The relevant weekly trading band was approximately 5,076–4,925. The upper part of the range, around 5,060–5,076, acted as short-term resistance, while the lower part, around 4,925–4,939, attracted buying interest, preventing a full breakdown. It also did not retest the deeper Pivot P support near 4,820 during this isolated weekly structure. Instead, price oscillated inside a cooling range, briefly rebounding toward the 5,006–5,007 area, which corresponds to the 0.382 Fibonacci threshold, but remained below the stronger recovery threshold around 5,140–5,150. Structurally, the market has moved from Repair into Cooling Consolidation. The previous recovery from the February low remains relevant in the broader context. Still, the latest week shows that buyers have not yet rebuilt enough strength to re-enter the higher segment.
- Market sentiment: Momentum remained corrective during the week, but the right edge shows signs of stabilization rather than fresh deterioration. PPO line has already been negative, while the signal line has remained positive, leaving the market in a corrective momentum configuration but not yet in a fully confirmed bearish momentum regime. At the same time, the PPO histogram has stayed below zero, but the latest bars have flattened. They may already be starting to hook upward, suggesting that downside momentum is no longer accelerating and may be entering a deceleration phase. RSI has stood near 48, confirming neutral-to-weak momentum rather than oversold conditions.
- Attention has also shifted toward breadth metrics at the bottom of the NWST1100 chart. Market breadth indicators weakened mainly through participation measures, not through clear money outflows. The Advance-Decline Volume Line (ADVPL) — 2100News’s proprietary adaptation of the AD Line for the crypto market — moved sideways with several rebounds during the week and did not show a sustained outflow pattern. This suggests that capital flow did not deteriorate decisively, even though the NWST1100 price remained in a lower range. The McClellan Summation Index, a long-term breadth indicator, continued to soften, confirming weaker participation momentum. Therefore, the internal picture was mixed: money flow remained relatively stable, while the breadth of participation narrowed.
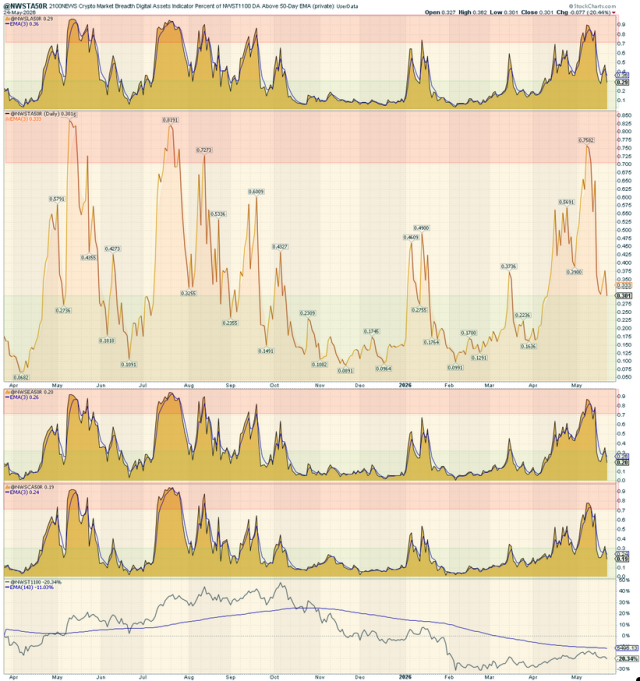
- A50R Participation: According to the chart on the right, across all major segments (NWST1100, NWSET100, NWSL100, NWSCo100), participation contracted sharply from the previous overbought recovery zone, and is now roughly in the 19%–30% range, confirming that the market has moved from broad participation strength into selective deterioration. Coins represented by NWSCo100 are the weakest segment in participation terms
*This breadth indicator is essential in measuring the internal strength or weakness of the underlying index. Looking at the chart on the right side, we can see the A50R lines for four different categories of digital assets:
- The top box shows the A50R lines for 100 Large-cap members of NWSL100.
- The middle box displays the A50R lines for 1100 members of NWST1100, which is the Total Index that measures the performance of significant crypto assets by market capitalization.
- The third box shows the A50R lines for 100 Ethereum Tokens members of NWSET100.
- The bottom box represents the A50R lines for NWSCo100’s 100 Coins members.
📉 Summary
The NWST1100 spent the week in Cooling Consolidation, trading inside a lower range after the earlier repair impulse had lost momentum. Price held above the lower weekly band but failed to reclaim the upper range. Momentum remained corrective. The week reflected cooling and narrower participation, not capitulation.
Outlook for the Week Ahead
This section provides a probabilistic assessment of the cryptocurrency market’s short-term trajectory. While markets remain inherently unpredictable, cyclical patterns in price behavior and momentum often reveal recurring structures that help identify the next likely phase of development.
- From a structural perspective, Pivot P should be treated as the next major structural test, not as a level already reached. The market has not confirmed a breakdown, but the failed attempt to recover the upper range keeps pressure tilted toward another support test.
- The RSI (Relative Strength Index) stood at 48 last week, in neutral-to-weak territory, confirming that momentum has cooled from the earlier rebound ceiling. Unless RSI stabilizes above the 50 midline, the market is more likely to continue testing the lower half of the current range before a stronger recovery attempt develops.
- The PPO histogram, which measures the rate of change (i.e., the first derivative) of PPO lines, is still in a negative cycle. However, the latest structure suggests that the negative histogram may begin narrowing toward the zero line. If this hook develops, it would indicate that downside momentum is starting to decelerate. At the same time, PPO lines may move below the zero line, keeping the market in a corrective lag.
-
The Breadth indicators at the bottom of the first chart (NWST1100) may signal a cooling phase. The Advance-Decline Volume Line (ADVL), adapted by 2100News for the crypto market as ADVPL, tracks the net money volume of advancing versus declining digital assets. ADVL may move sideways without a sustained outflow pattern. The McClellan Summation Index, a long-term measure of market breadth, may show early signs of turning upward by the end of the week. Such a turn would increase the likelihood of a relief rally after a test of support.
-
Importantly, this is a headline-sensitive environment. While the market has partially absorbed geopolitical risks (including developments related to Iran), any unexpected escalation or shift in the narrative could catalyze a sharp reaction.
📌 Target and Scenario Considerations:
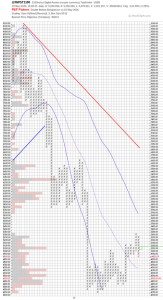
The most likely scenario is a move toward Pivot P near 4,820, followed by a relief rally if that level attracts buying interest. A rebound from this area would initially represent stabilization within Cooling Consolidation, not a confirmed return to Expansion. A sustained break below 4,820 would materially weaken the broader recovery structure and increase the risk of a renewed Breakdown phase. In that case, the Point & Figure chart’s bearish objective near 4,500 would become the next relevant downside reference.
📍 Key Levels to Watch:
-
Support: 4,820 (Pivot P), 4500 (Support S1)
-
Resistance: 5,150 (0.382 Fib retracement)
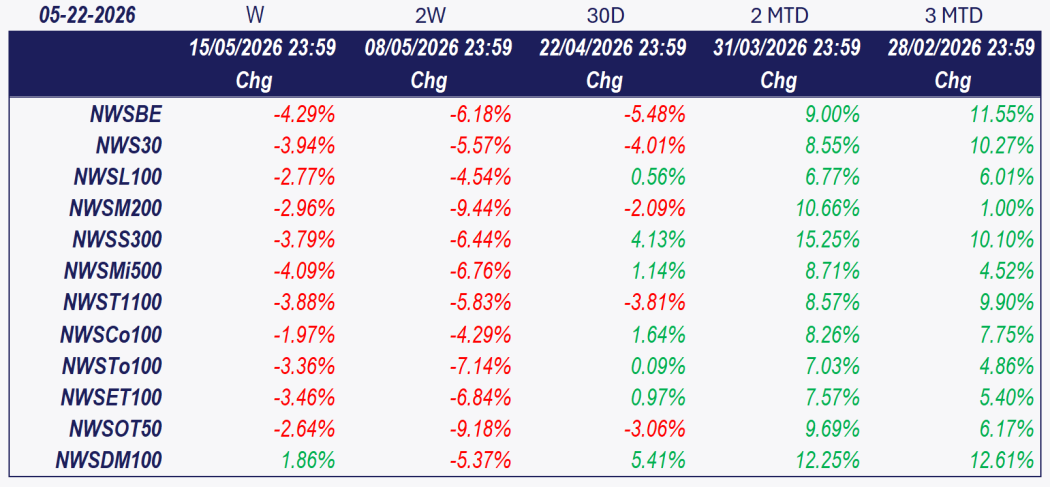
Investors and traders often rely on historical performance data to make informed decisions about their cryptocurrency holdings. After analyzing the table data, it is evident that Bitcoin and Ether lead the pullback. The overall index declined by 3.88% over the last week. 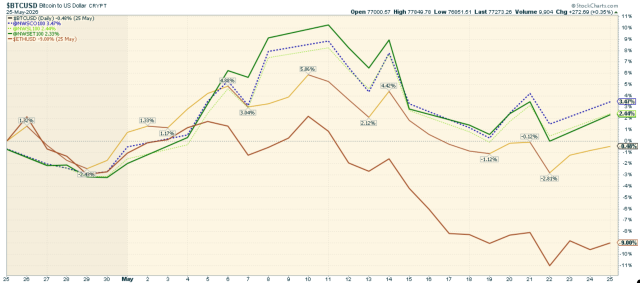 The accompanying chart highlights the performance of key cryptocurrencies, including Bitcoin and Ether, alongside the 2100NEWS Indices, which track Ethereum-based tokens (NWSET100), large caps (NWSL100), and coins (NWSCo100). Among these, coins represented by NWSCo100 were the strongest performer, up 3.47% over the past thirty days.

While the broader market has fallen, different segments and individual cryptocurrencies exhibit different performance dynamics.
Performance Trends by Market Segment:
✔ NWSET100 (Ethereum-based tokens), NWSL100 (Large Caps) and NWSCo100 (Coins) led,
✔ NWS30 was improving,
✔ Bitcoin was weakening,
✔ NWSBE and Ether lagged.
Investors and traders may use this information to adjust their portfolios, shifting focus toward assets with stronger relative momentum while remaining cautious about those in the Weakening quadrant.
*RRG® charts show the relative strength and momentum of groups of digital assets. Those with strong relative strength and momentum appear in the green Leading quadrant. As relative momentum fades, they typically move into the yellow Weakening quadrant. If relative strength then fades, they move into the red Lagging quadrant. Finally, when momentum picks up again, they shift into the blue Improving quadrant.
Crypto (Digital Assets) compared with global equity
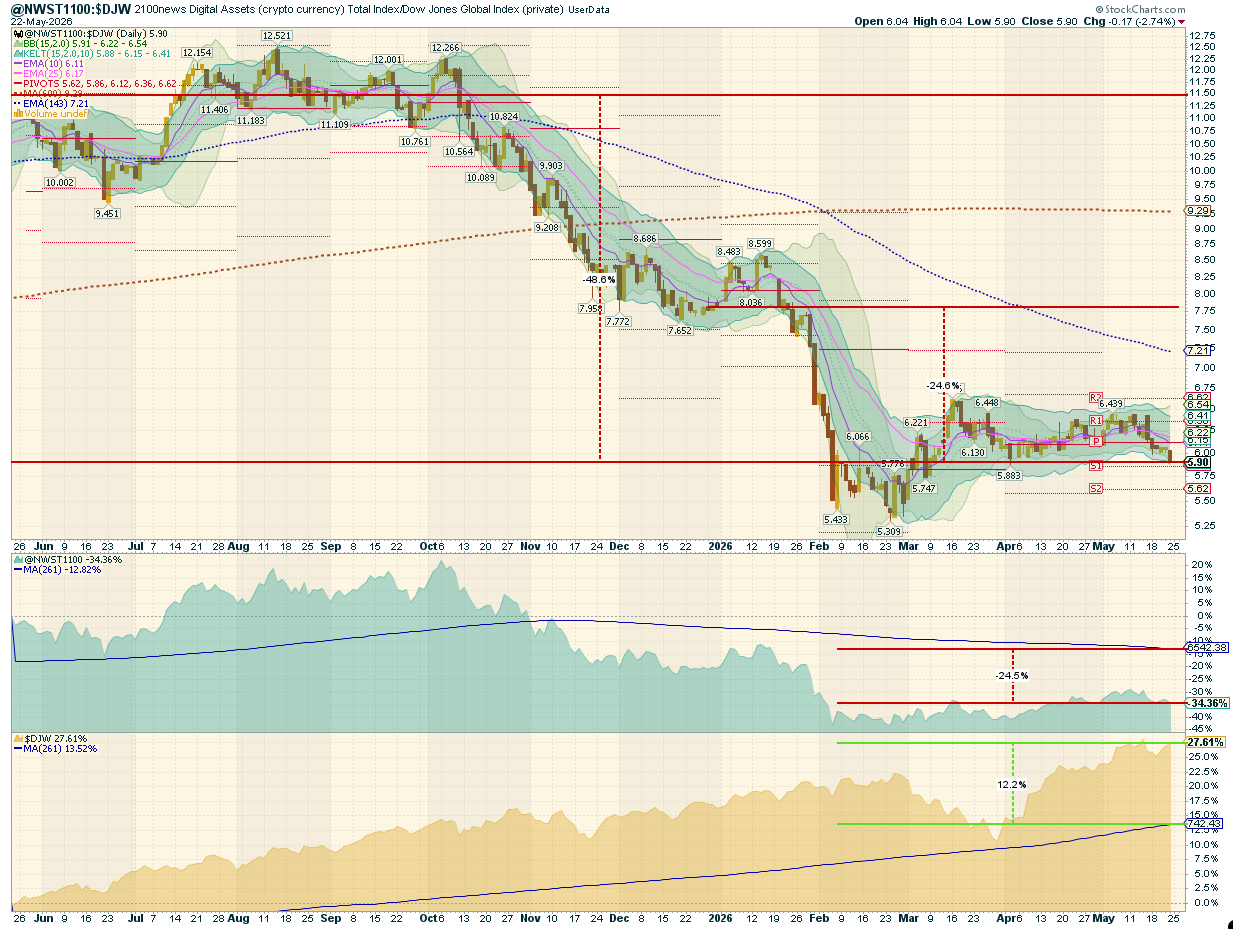
This report offers a comprehensive analysis comparing the performance of digital assets, as represented by the NWST1100 index, with that of shares on global capital markets, as measured by the Dow Jones Global W1Dow index. We draw insights into historical achievements and potential future trends by examining their performances across various time frames.
Let’s break down the key observations and implications:
- Historical Performance Comparison:
- 54 Months Ago: Digital assets vastly outperformed global equities in global capital markets, reaching a record high in the comparative quotient between the NWST1100 and W1Dow indexes. At this juncture, digital assets displayed a notably superior performance trajectory compared to shares on global capital markets.
- Over the past twelve months, digital assets have underperformed equities by 48.6%.
- Mean Reversion Opportunity:
- The average quotient price, represented by a blue dashed curve, has been 7.21 over the past 143 working days, while the current spot ratio is 5.90, lower than the long-term mean of 9.29.
- The mean reversion theory suggests that asset prices tend to revert to their historical average returns over time. The current NWST1100-to-DJW price ratio, which is below the long-run mean, may indicate that digital assets are undervalued relative to historical trends.
- Returns Comparison (12-month Accumulation Method) & Strategic Investment Timing:
- The chart also presents the returns achieved by the simplified index-based accumulation approach—buying one index point per day over 12 months—to simulate a mechanical build-up of exposure. While this method is not equivalent to classical dollar-cost averaging (which involves investing a fixed amount of capital daily), it provides a consistent benchmark for comparing historical costs and returns. The NWST1100 Crypto Index has dropped by 34.36% over the past twelve months. With daily index investments, an investor’s stock price would have resulted in a 24.5% loss from the current index price, due to unprofitable purchases at high entry prices during a prolonged market uptrend, when prices remained above the 143-day moving average for an extended period.
- The DJW, a broad-based global equity index, rose 27.61% over the past 12 months. However, a daily purchase strategy would have resulted in an 12.2% gain.
- Conclusion:
*The box in the middle of the chart shows the original NWST1100 price; at the bottom is W1Dow.
Indices Revision 5-22-2026
Following the latest biweekly revision, KITE AI, Stable, and Venice Token improved their ranking and were added to the NWSL100 index. On the other hand, Humanity Protocol, AINFT, and JasmyCoin were removed from the NWSL100 index. Meanwhile, several adjustments were made to the mid-cap index (NWSM200), with new projects introduced and weaker ones removed, reflecting the ongoing dynamism of that segment. The new mid-cap assets, including Billions Network, Sahara AI, and Irys, have been added to the NWSM200 index. Each index’s presentation provides more details on additions and deletions across the broader 2100NEWS index family.
Winning member
Congratulations to Venice Token (VVV) on achieving a significant milestone: being recognized as the winning member of the NWSL100 crypto index, marking a crucial leap in the index’s constituent rankings.
*We elect the member of the NWSL100 crypto index with the most significant jump in our ranking. We will examine how the market assesses the project’s progress in the event of price changes. It seems important to us whether the project is out of the ordinary tide of crypto project prices. Peer comparisons should be efficient and effective, from an investor’s perspective.

Venice Token (VVV) https://venice.ai/home
2100NEWS DA Orderbook Quality Evaluation Grade: Poor, Score: 13.1 (Average for Large-caps: 16.6)
Over the past week, the average market capitalization was $756.2 million, and the average daily trading volume was $84.4 million.
Venice is a privacy-focused AI platform that offers services such as generating conversations and creating images, but it does not store user data. In addition, Venice aims to eliminate any form of censorship on the platform.

 Lily
Lily


 Litecoin