


2100NEWS WEEKLY CRYPTO REPORT Nov-21

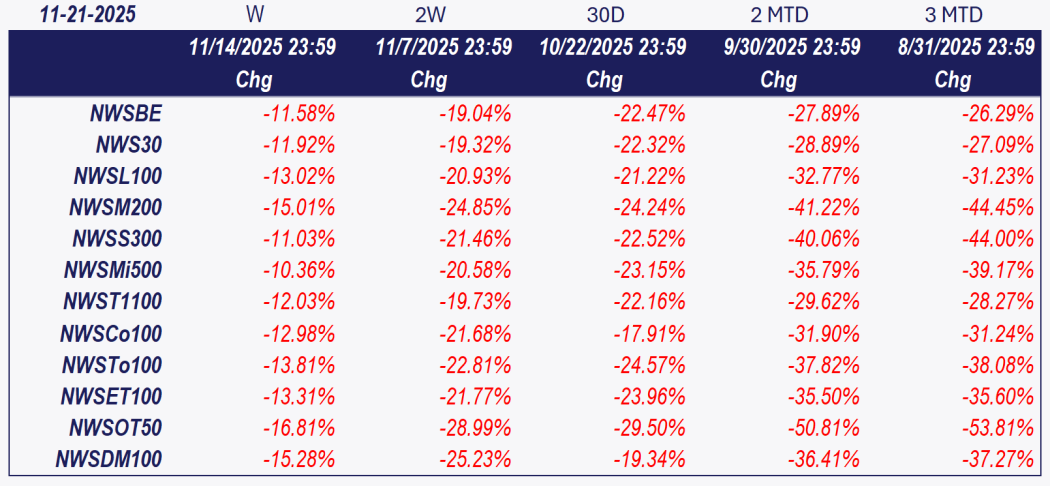
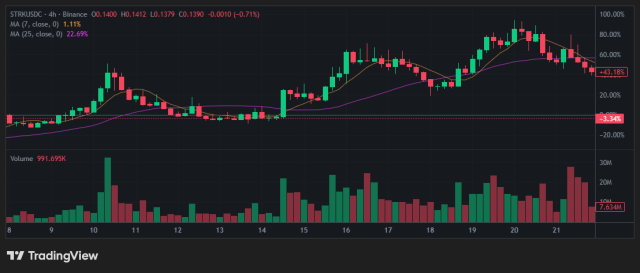
The NWST1100 index fell 12.03% last week; Starknet (STRK), a large-cap Ethereum-based Token, has made the most significant leap in rank within the NWSL100 crypto index on a biweekly basis.
*Below, we present a standardized weekly report and next week’s outlook, prepared based on the Theory Swingtum of intelligent finance. We gauge the crypto market’s breadth and direction by showing the 2100NEWS Digital Assets Total Index (NWST1100), which measures the performance of 1100 (by market capitalization) significant crypto assets. The information-laden chart is complex to read initially, but it effectively displays essential price information, key decision-making levels, momentum, trading volumes, and crypto market breadth. Monitoring Market Sentiment and Breadth is necessary to detect early signs of trend reversals or continued strength.

 Our detailed analysis of the NWST1100 chart and related market indicators reveals essential insights into the current market conditions:
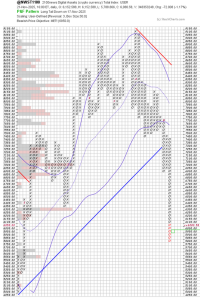
The NWST1100 index declined 12.03%, continuing its descent within a well-defined descending channel. The pattern across all timeframes shows repeated failures at mid-channel resistance and Fibonacci retracement levels, confirming persistent distribution pressure. Each intraday rally failed to sustain momentum — on November 21, the index reached a new local low near 5,788, approaching the lower boundary of the three-week channel.
- Market sentiment: Momentum indicators confirm that the market remains under intense bearish control. The Price Oscillator (PPO) lines accelerated lower, and the PPO histogram stayed sharply negative, highlighting sustained downside momentum. The RSI dropped to 28, entering deep oversold territory and signaling exhaustion, but not yet a reversal.
- Attention has also shifted toward breadth metrics at the bottom of the NWST1100 chart, further confirming the deterioration in the internal market structure. The Advance-Decline Volume Line (ADVPL) — 2100News’s proprietary adaptation of the AD Line for the crypto market — continued to decline, showing that outflows dominated across segments. Similarly, the McClellan Summation Index, a long-term breadth oscillator, also extended lower, confirming contraction in participation and the absence of accumulation behavior.
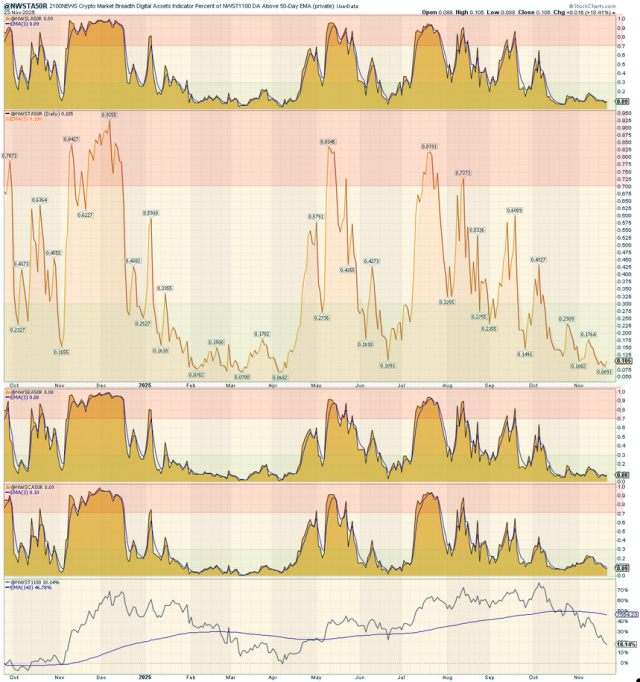
According to the chart on the right, across all major segments (NWST1100, NWSET100, NWSL100, NWSCo100), A50R readings — the share of assets trading above their 50-day EMAs — have dropped to capitulation levels from 8% to 10%, indicating broad market capitulation. Ethereum Tokens (NWSET100) cohort remains the weakest, with only 8% of its constituents above their 50-day averages. Overall, the breadth structure signals deep capitulation, potentially preceding early stabilization rather than continued correction.
*This breadth indicator is essential in measuring the internal strength or weakness of the underlying index. Looking at the chart on the right side, we can see the A50R lines for four different categories of digital assets:
- The top box shows the A50R lines for 100 Large-cap members of NWSL100.
- The middle box displays the A50R lines for 1100 members of NWST1100, which is the Total Index measuring the performance of significant crypto assets based on market capitalization.
- The third box shows the A50R lines for 100 Ethereum Tokens members of NWSET100.
- The bottom box represents the A50R lines for NWSCo100’s 100 Coins members.
📉 Summary
The crypto market spent the entire week entrenched in a controlled, well-defined downtrend. Every rebound was corrective, not impulsive. NWST1100 and NWSBCT formed descending channels with clear lower highs and lower lows, confirming dominant selling control. RSI readings below 30 signal exhaustion, yet no reversal confirmation has appeared. From a structural perspective, this phase represents late-stage decline within a corrective wave, where volatility often spikes and short-covering bounces emerge — but broader market conditions remain bearish.
Outlook for the Week Ahead
This section provides a probabilistic assessment of the cryptocurrency market’s short-term trajectory. While markets remain inherently unpredictable, cyclical patterns in price behavior and momentum often reveal recurring structures that help identify the next likely phase of development.
- The market begins the new week near the lower boundary (~6,000–6,200) of the descending channel, a region that could trigger short-term volatility spikes and reflexive rebounds. However, given the profoundly negative momentum and fragile breadth, any recovery attempts are expected to be technical and short-lived, not yet the start of a sustainable uptrend.
- The RSI (Relative Strength Index) stood at 28 last week and may bounce slightly toward 35–40, reflecting oversold relief rather than a trend change.
- The PPO histogram, which measures the rate of change (i.e., the first derivative) of PPO lines, may begin rising toward zero, leading PPO lines to flatten as downside momentum slows.
- The Breadth indicators at the bottom of the first chart (NWST1100) may stabilize: The Advance-Decline Volume Line (ADVL), adapted by 2100News for the crypto market as ADVPL, tracks the net money volume of advancing versus declining digital assets. It may stabilize briefly as selling intensity cools. The McClellan Summation Index, a long-term version of the McClellan Oscillator that measures market breadth, may also flatten, hinting at initial stabilization in participation.
📌 Target and Scenario Considerations:
Most likely scenario: The cryptocurrency market may begin a technical recovery following the sharp mid-November decline. Momentum, breadth, and structure suggest that the mid-November low could mark a durable short-term bottom.
Short-term volatility will likely persist, but the emerging pattern — similar to the March recovery phase (see arrows on chart) — supports a constructive outlook heading into December. The NWST1100 index may attempt a rebound early in the week toward Pivot P (6,450–6,500), where resistance is expected. If sellers reassert control, the index could retest or slightly undercut support near 6,000 before entering a sideways consolidation phase. Historically, late November often produces volatility clusters before year-end positioning, implying that short-term oversold rebounds are likely but unreliable as trend reversals.
📍 Key Levels to Watch:
-
Support: 5,750
-
Resistance: 6,350 (Pivot S2, Fibonacci 0.236), 6,700 (Fibonacci 0.382 / 10-day EMA)
Investors and traders often rely on historical performance data to make informed decisions about their cryptocurrency holdings. After analyzing the table data, it is evident that the crypto market plunged; the overall index declined by 12.03% over the last week. 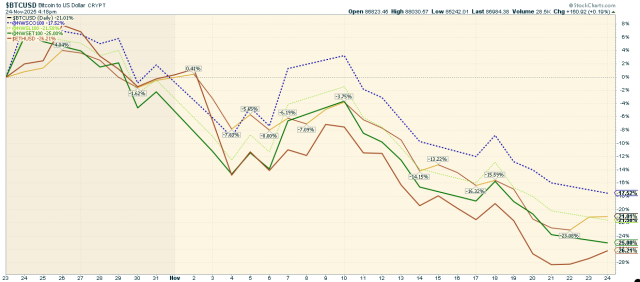 The accompanying chart highlights the performance of key cryptocurrencies, including Bitcoin and Ether, alongside the 2100NEWS Indices, which track Ethereum-based tokens (NWSET100), large caps (NWSL100), and coins (NWSCo100). Among these, coins (NWSCo100) stood out, outperforming other segments with only a 17.52% loss over the past thirty days.
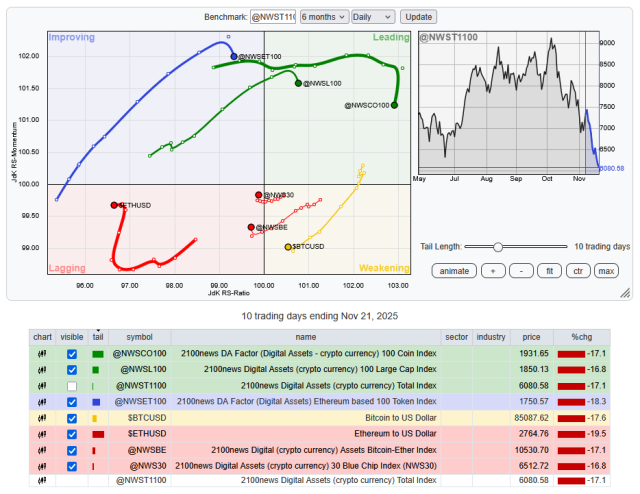
While the broader market has advanced, different segments and individual cryptocurrencies exhibit different performance dynamics.
Performance Trends by Market Segment:
✔ NWSCo100 (Coins) and NWSL100 (Large Caps) led the market,
✔NWSET100 (Ethereum-based tokens) improved, showing notable strength.
✔ Bitcoin weakened,
✔ Ether, NWS30, and NWSBE lagged.
Investors and traders might use this information to adjust their portfolios, possibly shifting focus toward assets with stronger relative momentum while being cautious about those in the Weakening quadrant.
*RRG® charts show the relative strength and momentum of groups of digital assets. Those with strong relative strength and momentum appear in the green Leading quadrant. As relative momentum fades, they typically move into the yellow Weakening quadrant. If relative strength then fades, they move into the red Lagging quadrant. Finally, when momentum picks up again, they shift into the blue Improving quadrant.
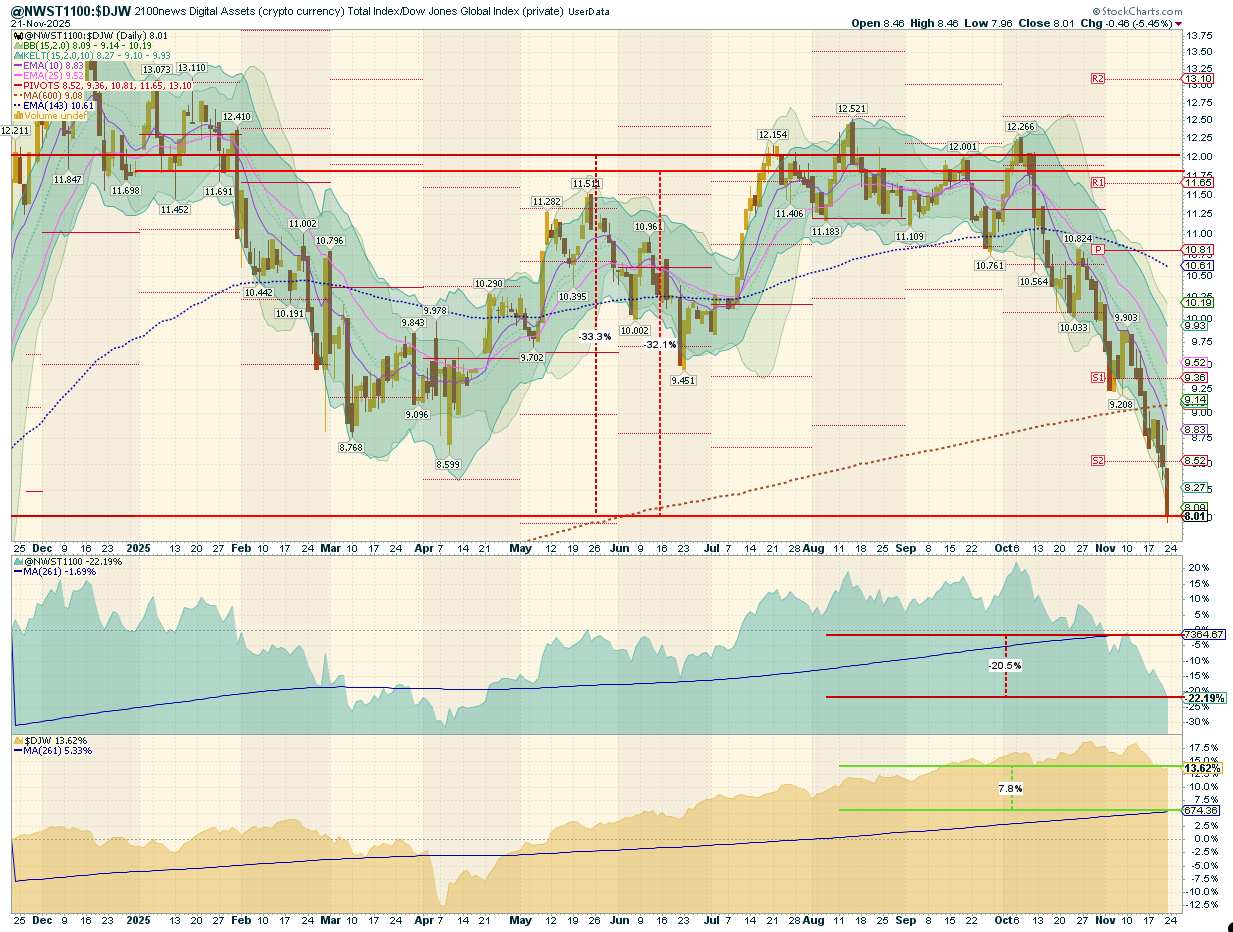
Crypto (Digital Assets) compared with global equity
This report offers a comprehensive analysis comparing the performance of digital assets, as represented by the NWST1100 index, with that of shares on global capital markets, as measured by the Dow Jones Global W1Dow index. We draw insights into historical achievements and potential future trends by examining their performances over various time frames.
Let’s break down the key observations and implications:
- Historical Performance Comparison:
- Four Years Ago: Digital assets vastly outperformed global equities in global capital markets, reaching a record high in the comparative quotient between the NWST1100 and W1Dow index.
- From twelve months ago to the Present, digital assets have underperformed equities by 33.3%.
- Mean Reversion Opportunity:
- The average quotient price, represented by a blue dashed curve, has been 10.61 over the past 143 working days, while the current spot price is 8.01. This is lower than the long-term mean of 9.08, which has increased since October last year.
- The mean reversion theory suggests that asset prices tend to revert to their historical average returns over time. The current average prices’ quotient, which is below the long-run mean, could imply that digital assets are undervalued relative to historical trends.
- Returns Comparison (12-month Accumulation Method) & Strategic Investment Timing:
- The chart also presents the returns achieved by the simplified index-based accumulation approach—buying one index point per day over 12 months—to simulate a mechanical exposure build-up. While this method is not equivalent to classical dollar-cost averaging (which involves investing a fixed amount of capital daily), it provides a consistent benchmark for comparing historical costs and returns. The NWST1100 Crypto Index has dropped by 22.19% over the past twelve months. With daily index investments, an investor’s stock price would have resulted in a 20.5% loss from the current index price, because of unprofitable purchases at high entry prices during a prolonged market uptrend when prices remained above the 143-day moving average for an extended period.
- The DJW, representing global capital market shares, grew by 13.62% over the past twelve months. However, a daily purchase strategy would have resulted in a 7.8% gain.
- Conclusion:
*The box in the middle of the chart shows the original NWST1100 price; at the bottom is W1Dow.
Indices Revision 11-21-2025
Following the latest biweekly revision, the Canton Network and Morpho improved their rankings and were added to the NWSL100 index. On the other hand, Synthetix and EigenLayer were removed from the NWSL100 index. Meanwhile, several adjustments were made to the mid-cap index (NWSM200), with new projects introduced and weaker ones removed, reflecting the ongoing dynamism of that segment. The new mid-cap assets, including AB, SOON, Kite, and others, have been added to the NWSM200 index. Each index’s presentation provides more details on additions and deletions across the broader 2100NEWS index family.
Winning member
Congratulations to Starknet (STRK) on achieving a significant milestone: being recognized as the winning member of the NWSL100 crypto index, marking a crucial leap in rank within the index.
*We elect the member of the NWSL100 crypto index with the most significant jump in our ranking. We will examine how the market rates the project’s progress in case of price changes. It seems important to us whether the project is out of the ordinary tide of crypto project prices. Peer comparisons should be efficient and effective, from an investor’s perspective.
Starknet (STRK) https://www.starknet.io/
STRK, a large-cap Ethereum-based Token, is ranked 54th in the 2100NEWS ranking. It is an Index member: NWST1100, NWSL100, NWSTo100, NWSET100
2100NEWS DA Orderbook Quality Evaluation Grade: Ordinary, Score: 17.7, (Average for Large-caps: 17.6)
Over the past week, the average market capitalization was $865.6 million, and the average daily trading volume was $501.3 million.
Starknet is a Validity-Rollup (aka ZK-Rollup) Layer 2 network that runs on top of Ethereum, enabling dApps to scale massively without compromising security. It achieves this by bundling transactions into an off-chain computed STARK proof. This proof is then submitted to Ethereum as a single transaction, resulting in significantly higher throughput, faster processing times, and much lower costs, all while retaining the robust security of the Ethereum settlement layer. The STRK was created to allow
 Litecoin