


2100NEWS WEEKLY CRYPTO REPORT Oct-10

The NWST1100 index plunged by 12.36% last week; Zcash (ZEC), a large-cap Coin, has made the most significant leap in rank within the NWSL100 crypto index on a biweekly basis.
*Below, we present a standardized weekly report and next week’s outlook, prepared based on the Theory Swingtum of intelligent finance. We gauge the crypto market’s breadth and direction by showing the 2100NEWS Digital Assets Total Index (NWST1100), which measures the performance of 1100 (by market capitalization) significant crypto assets. The information-laden chart is complex to read initially, but it effectively displays essential price information, key decision-making levels, momentum, trading volumes, and crypto market breadth. Monitoring Market Sentiment and Breadth is necessary to detect early signs of trend reversals or continued strength.

 Our detailed analysis of the NWST1100 chart and related market indicators reveals essential insights into the current market conditions:
The NWST1100 index plunged by 12.36% last week, breaking through several key support layers and erasing the late-September gains. What began as a healthy consolidation quickly evolved into a capitulation event as global risk aversion surged following the U.S. administration’s announcement of new 100% tariffs on Chinese exports. On Friday, October 10, the index suffered one of its steepest one-day declines of 2025, collapsing 10.5% and invalidating the prior uptrend. The drop forced a full retest of long-term dynamic support at the 143-day EMA (~7,900), where the decline temporarily stabilized.
- Market sentiment: The Price Oscillator (PPO) lines turned downward and widened, a classical sign of renewed bearish control. The PPO histogram reversed sharply into negative territory, confirming the loss of upward momentum. The RSI dropped to 40, reflecting downside acceleration but not yet a technical oversold condition.
- Attention has shifted to breadth indicators at the bottom of the NWST1100 chart, which have deteriorated. The Advance-Decline Volume Line (ADVL), adapted by 2100News for the crypto market as ADVPL, tracks the net money volume of advancing versus declining digital assets. It collapsed, showing substantial outflows from advancing assets. The McClellan Summation Index, a long-term version of the McClellan Oscillator that measures market breadth, accelerated lower, signaling contraction in market participation.

According to the chart on the right, all A50R indicator readings across all major segments (NWST1100, NWSET100, NWSL100, NWSCo100) confirm a broad-based bearish breadth profile. Currently, only 18% of NWST1100 constituents are above their 50-day EMA. Coins (NWSC0100) and Ethereum-based tokens (NWSET100) have been weaker cohorts, with 11–13% of their constituents above their 50-day averages. The overall breadth structure implies a market in capitulation rather than controlled correction.
*This breadth indicator is essential in measuring the internal strength or weakness of the underlying index. Looking at the chart on the right side, we can see the A50R lines for four different categories of digital assets:
- The top box shows the A50R lines for 100 Large-cap members of NWSL100.
- The middle box displays the A50R lines for 1100 members of NWST1100, which is the Total Index measuring the performance of significant crypto assets based on market capitalization.
- The third box shows the A50R lines for 100 Ethereum Tokens members of NWSET100.
- The bottom box represents the A50R lines for NWSCo100’s 100 Coins members.
📉 Summary
The crypto market reversed violently after reaching near the R1 resistance level (~9,150). Friday’s collapse, triggered by geopolitical and macro shocks, wiped out the previous week’s rally and pulled the index back below the 0.382 Fibonacci support. During the intraday capitulation, the index touched its 143-day exponential moving average (EMA143) near 7,700, a level that acted as dynamic long-term support and temporarily halted the decline. The NWST1100 closed at ~8,190, back within its price channel’s lower range. Momentum, breadth, and sentiment all turned negative; the short-term trend has shifted into a high-volatility down-swing.
Outlook for the Week Ahead
This report aims to provide probable insights into the cryptocurrency market’s near-term outlook. While complete predictability remains challenging, market waves exhibit some degree of predictability, with discernible patterns in market behavior. By examining momentum indicators, several signals emerge that offer insights into the market’s potential short-term direction.
- The market enters the new week following Friday’s sharp collapse, triggered by global macro and geopolitical shocks. The immediate technical reference point is Pivot P (~8,350), which now serves as initial resistance. The market’s reaction around this level will be pivotal in determining whether last week’s sell-off evolves into a stabilization phase or extends into further weakness.
- The RSI (Relative Strength Index) stood at 40 last week, a soft-neutral reading that may continue drifting lower before any sustained recovery attempt emerges.
- The PPO histogram, which measures the rate of change (i.e., the first derivative) of PPO lines, remains negative and is likely to stay there for most of the week. It may begin to curve upward within the red zone, signaling slowing downside momentum, but not yet a reversal. As long as the histogram remains below zero, the PPO lines will continue to decline, likely crossing and remaining below the zero line, confirming that the market remains in a bearish momentum regime.
- The Breadth indicators at the bottom of the first chart (NWST1100) may stabilize: The Advance-Decline Volume Line (ADVL), adapted by 2100News for the crypto market as ADVPL, tracks the net money volume of advancing versus declining digital assets. It may stop falling, suggesting that selling intensity could ease temporarily, even as the broader structure remains weak. The McClellan Summation Index, a long-term version of the McClellan Oscillator that measures market breadth, may flatten near current levels, reflecting partial stabilization in market participation rather than a renewed inflow.
📌 Target and Scenario Considerations:
Most likely scenario: The NWST1100 index is expected to remain confined to the lower halves of the Bollinger and Keltner bands while digesting Friday’s sharp decline. A limited rebound toward Pivot P (~8,350) may occur early in the week, but resistance there is likely to trigger renewed selling. If the sale resumes, the index could retest the lower boundary (~7,850) — aligning with Pivot S1 and the 143-day EMA — before attempting to form a short-term base. This process would allow momentum indicators to complete their reset phase, setting the stage for a potential recovery later in October.
📍 Key Levels to Watch:
-
Support: 7,850 (Pivot S1, 143-day EMA)
-
Resistance: 8,350 (Pivot P)
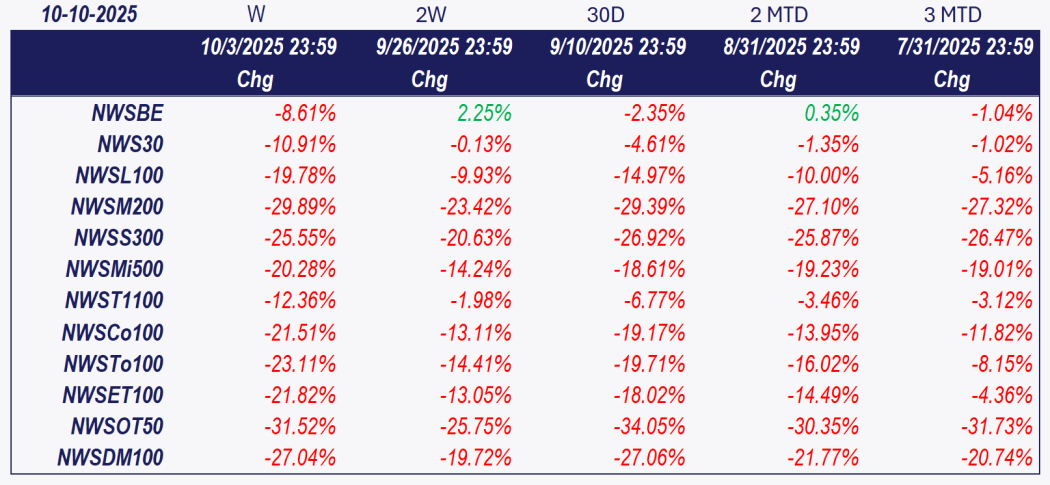
Investors and traders often rely on historical performance data to make informed decisions about their cryptocurrency holdings. After analyzing the table data, it is evident that the crypto market experienced a significant decline; the overall index plunged by 12.36% over the last week. 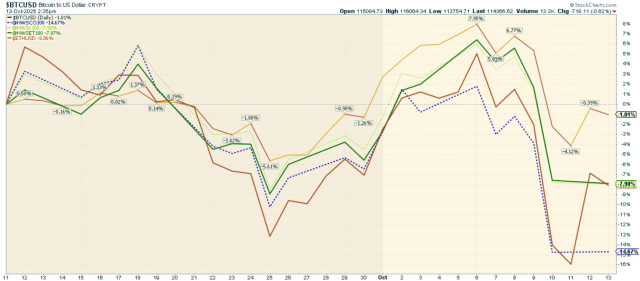 The accompanying chart highlights the performance of key cryptocurrencies, including Bitcoin and Ether, alongside the 2100NEWS Indices, which track Ethereum-based tokens (NWSET100), large caps (NWSL100), and coins (NWSCo100). Among these, Bitcoin stood out, outperforming other segments with only a 1.01% loss over the past thirty days.
While the broader market has rallied, different segments and individual cryptocurrencies exhibit different performance dynamics.
Performance Trends by Market Segment:
✔ NWS30, Bitcoin, and NWSBE led the market,
✔ Ether improved, showing notable strength.
✔ NWSCo100 (Coins), NWSL100 (Large Caps), and NWSET100 (Ethereum-based tokens) lagged.
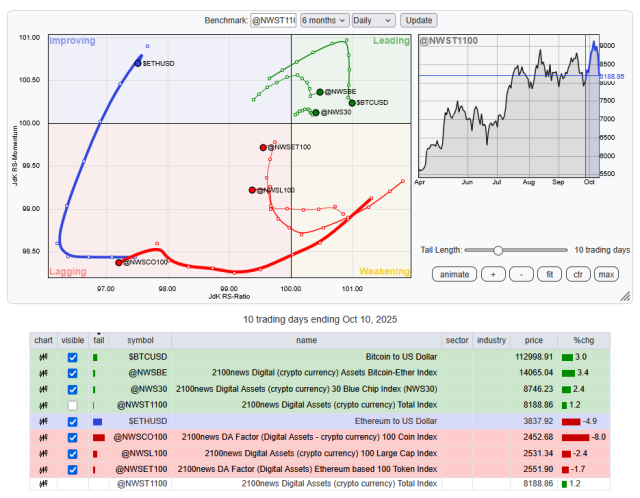
Investors and traders might use this information to adjust their portfolios, possibly shifting focus toward assets with stronger relative momentum while being cautious about those in the Weakening quadrant.
*RRG® charts show the relative strength and momentum of groups of digital assets. Those with strong relative strength and momentum appear in the green Leading quadrant. As relative momentum fades, they typically move into the yellow Weakening quadrant. If relative strength then fades, they move into the red Lagging quadrant. Finally, when momentum picks up again, they shift into the blue Improving quadrant.
Crypto (Digital Assets) compared with global equity
This report offers a comprehensive analysis comparing the performance of digital assets, as represented by the NWST1100 index, with that of shares on global capital markets, as measured by the Dow Jones Global W1Dow index. We draw insights into historical achievements and potential future trends by examining their performances over various time frames.
Let’s break down the key observations and implications:
- Historical Performance Comparison:
- 47 Months Ago: Digital assets vastly outperformed global equities in global capital markets, reaching a record high in the comparative quotient between the NWST1100 and W1Dow index.
- From twelve months ago to the Present, digital assets have outperformed equities by 44.4%.
- Mean Reversion Opportunity:
- The average quotient price, represented by a blue dashed curve, has been 11.06 over the past 143 working days, while the current spot price is 10.75. This is higher than the long-term mean of 8.86, which has increased since October.
- The mean reversion theory suggests that asset prices tend to revert to their historical average returns over time. The current average prices’ quotient, which is above the long-run mean, could imply that digital assets are highly valued relative to historical trends.
- Returns Comparison (12-month Accumulation Method) & Strategic Investment Timing:
- The chart also presents the returns achieved by the simplified index-based accumulation approach—buying one index point per day over 12 months—to simulate a mechanical exposure build-up. While this method is not equivalent to classical dollar-cost averaging (which involves investing a fixed amount of capital daily), it provides a consistent benchmark for comparing historical costs and returns. The NWST1100 Crypto Index has risen by 64.23% over the past twelve months. With daily index investments, an investor’s stock price would have resulted in a gain of 9.6% on the current index price, despite unprofitable purchases due to high entry prices during a prolonged market uptrend when prices remained above the 143-day moving average for an extended period.
- The DJW, representing global capital market shares, grew by 14.39% over the past twelve months. However, a daily purchase strategy would have resulted in a 10.4% gain.
- Conclusion:
*The box in the middle of the chart shows the original NWST1100 price; at the bottom is W1Dow.

Indices Revision 10-10-2025
Following the latest biweekly revision, Aster, Plasma, EigenLayer, and SPX6900 improved their rankings and were added to the NWSL100 index. On the other hand, MYX Finance, BitTorrent, and Kaia were removed from the NWSL100 index. Meanwhile, several adjustments were made to the mid-cap index (NWSM200), with new projects introduced and weaker ones removed, reflecting the ongoing dynamism of that segment. The new mid-cap assets, including DoubleZero, Falcon Finance, Vision, and others, have been added to the NWSM200 index. Each index’s presentation provides more details on additions and deletions across the broader 2100NEWS index family.
Winning member
Congratulations to Zcash (ZEC) on achieving a significant milestone: being recognized as the winning member of the NWSL100 crypto index, marking a crucial leap in rank within the index.
*We elect the member of the NWSL100 crypto index with the most significant jump in our ranking. We will examine how the market rates the project’s progress in case of price changes. It seems important to us whether the project is out of the ordinary tide of crypto project prices. Peer comparisons should be efficient and effective, from an investor’s perspective.
Zcash (ZEC) https://z.cash/
ZEC, a large-cap Coin, is ranked 34th in the 2100NEWS ranking. It is an Index member: NWST1100, NWSL100, NWSCo100
https://www.kaia.io/2100NEWS DA Orderbook Quality Evaluation Grade: Ordinary, Score: 17.4 (Average for Large-caps: 17.4)
Over the past week, the average market capitalization was $3,381.7 million, and the average daily trading volume was $790.4 million.
ZCash is a privacy-driven cryptocurrency. It uses Equihash, an asymmetric, memory-hard Proof-of-Work algorithm based on the generalized birthday problem. It relies on high RAM requirements to bottleneck the generation of proofs and make ASIC development unfeasible. ZCash uses zero-knowledge Succinct Non-interactive Arguments of Knowledge (zk-SNARKs) to ensure that all information (sender, receiver, amount) is encrypted, without the possibility of double-spending. Information about transactions includes the time at which they take place.


 Litecoin