


2100NEWS WEEKLY CRYPTO REPORT Oct-25

The NWST1100 index retraced 2.53% from the previous week. ApeCoin (APE), a large-cap Ethereum-based Token, has biweekly made the most significant leap in rank within the NWSL100 crypto index.
*Below, we present a standardized weekly report and next week’s outlook, prepared based on the Theory Swingtum of intelligent finance. We gauge the crypto market’s breadth and direction by showing charts 2100NEWS Digital Assets Total Index (NWST1100), which measures 1100 (by market capitalization) significant crypto assets’ performance. The information-laden chart is complex to read initially, but the chart shows essential price information, crucial decisive price levels, momentum, trading volumes, and crypto market breadth. Monitoring Market Sentiment and Breadth is necessary to detect early signs of trend reversals or continued strength.
 Our detailed analysis of the NWST1100 chart and related market indicators reveals essential insights into the current market conditions:
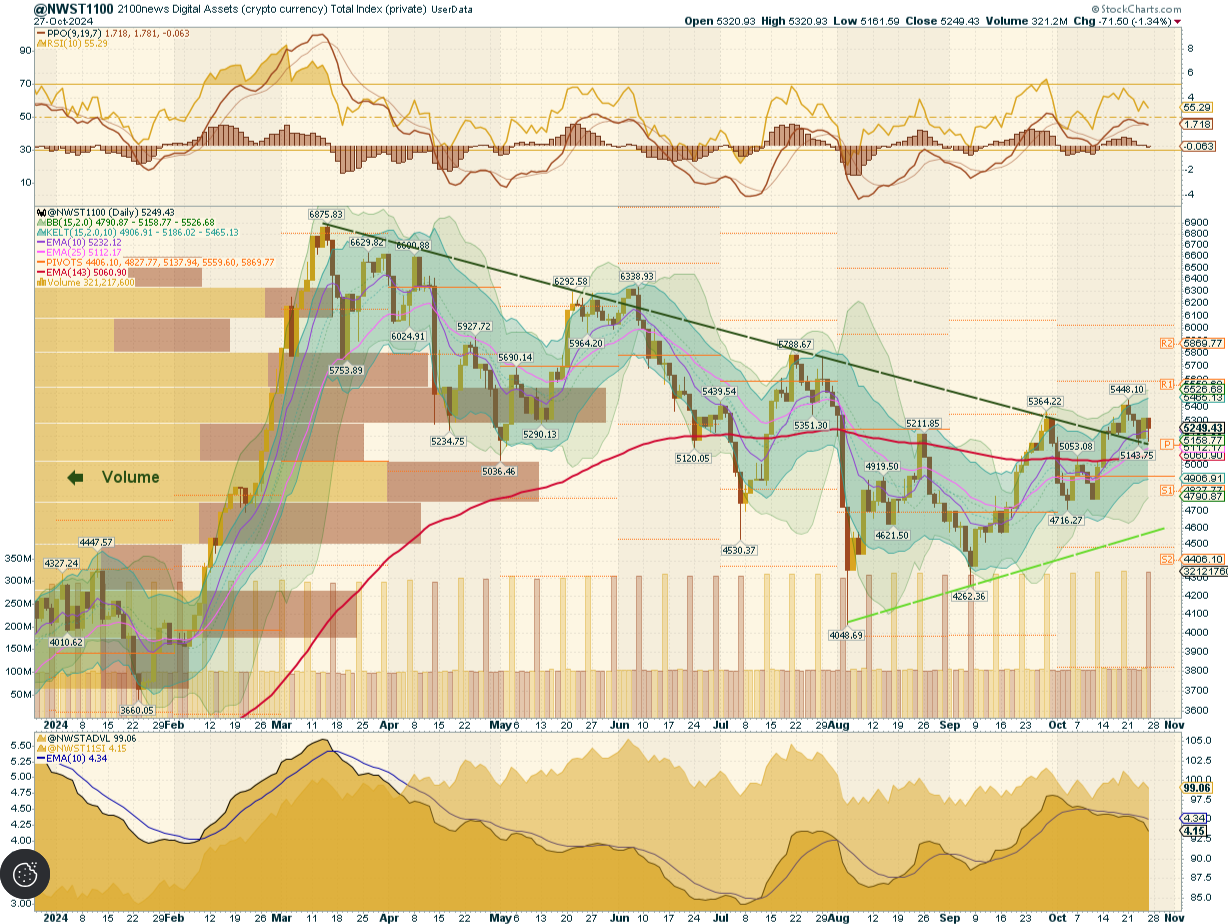
- The analysis of the NWST1100 chart shows that the index peaked on Monday but then displayed four days of indecisive movement above the upper descending trend line. This “hovering” behavior around a critical level suggests market hesitation and a lack of directional solid conviction among investors.
- Market sentiment: The Price Oscillator (PPO) lines and histogram have turned downward, signaling a potential correction. This shift in PPO lines usually indicates waning momentum and can often precede a period of market retracement. The RSI (Relative Strength Index) has also started trending downward, reinforcing the signs of a corrective phase in the market as buying pressure weakens.
- We are now focusing on the breadth indicators at the bottom of the NWST1100 chart. The Advance-Decline Line (ADVL) started falling, while the McClellan Summation Index continued to decline, indicating underlying weakness in the market’s breadth and suggesting a broader retracement.
These indicators collectively suggest a negative shift in overall market sentiment, with increased selling activity and broader market retracement.
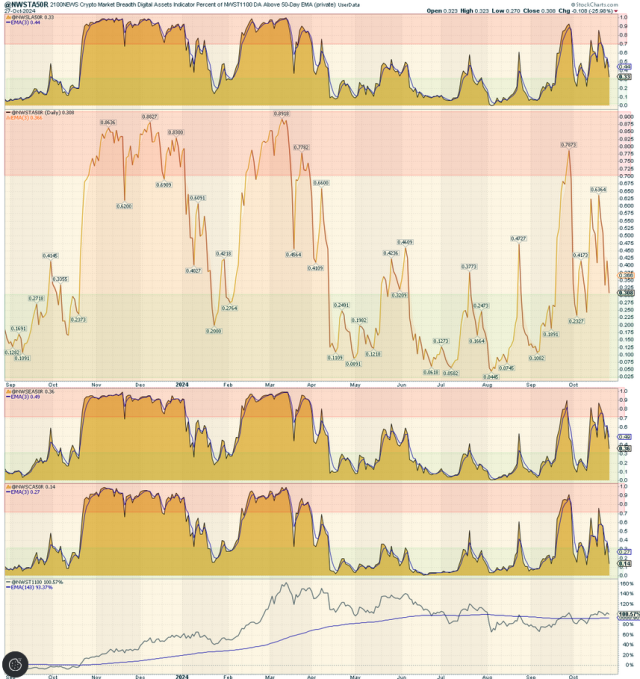
According to the chart on the right, three A50R lines were falling and settled in neutral territory; coins were even oversold. This condition suggests that 30% of cryptocurrencies on the crypto market were trading above their 50-day moving averages, signaling cautious market momentum and highlighting limited buying strength. This breadth indicator measures the percentage of digital assets trading above a 50-day moving average.
*This breadth indicator is essential in measuring the internal strength or weakness of the underlying index. Looking at the chart on the right side, we can see the A50R lines for four different categories of digital assets:
- The top box shows the A50R lines for 100 Large-cap members of NWSL100.
- The middle box displays the A50R lines for 1100 members of NWST1100, which is the Total Index measuring the performance of significant crypto assets based on market capitalization.
- The third box shows the A50R lines for 100 Ethereum Tokens members of NWSET100.
- The bottom box represents the A50R lines for 100 Coins members of NWSCo100., tako
Outlook for this week
This report aims to provide insights into the cryptocurrency market’s near-term outlook. While complete predictability remains challenging, the market waves show some degree of predictability with discernible patterns in market behavior. By examining momentum indicators, several signals emerge that offer insights into the potential direction of the market in the short term.
- The RSI (Relative Strength Index), with a current reading of 55, shows that the market is bullish, where buying pressure remains dominant, but levels aren’t yet extreme. This reading suggests that the market has room to grow before it reaches overbought territory, implying further potential upside.
- The PPO lines and histogram, which measure the market’s momentum, may shift direction later in the week. If this shift aligns with other indicators, it could signal renewed bullish momentum, reinforcing the possibility of upward movement in the near term.
- The Breadth indicators at the bottom of the first chart (NWST1100), which reflect the participation of assets in the market movement, may show signs of stabilization. This implies that the decline in these indicators may be slowing, signaling renewed buying interest and broader participation in any upcoming rally.
In conclusion, the market appears to have room for further growth in the short term. Key support levels must be closely monitored to assess the strength of correction. A rebound from these levels could lead to a significant upward move in the market. After a test of resistance levels, the NWST1100 index could approach Pivot R1, potentially rallying above this level if momentum persists.
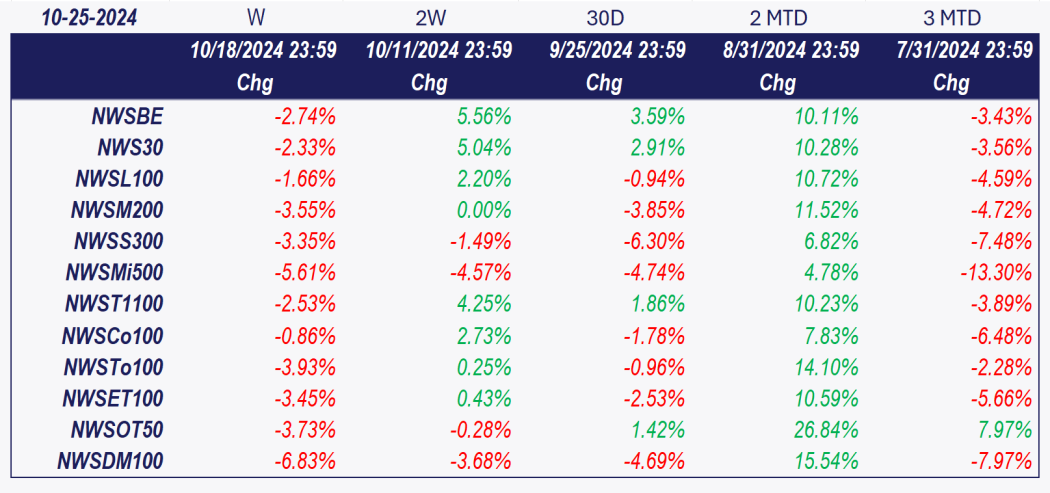
Investors and traders often rely on historical performance data to make informed decisions about their cryptocurrency holdings. After analyzing the data in the table, it can be seen that the overall index has retraced by 2.53% over the last week. 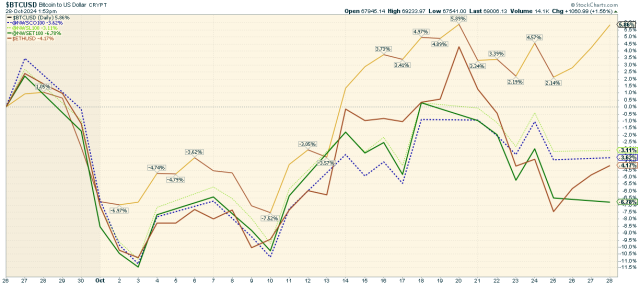 The chart above highlights the performance of various cryptocurrencies, such as Bitcoin, Ether, and the 2100NEWS Indices, which represent the performance of Ethereum-based tokens (NWSET100), Large caps (NWSL100), and Coins (NWSCo100). Bitcoin has outperformed other segments, with a gain of 5.86% over the last thirty days.
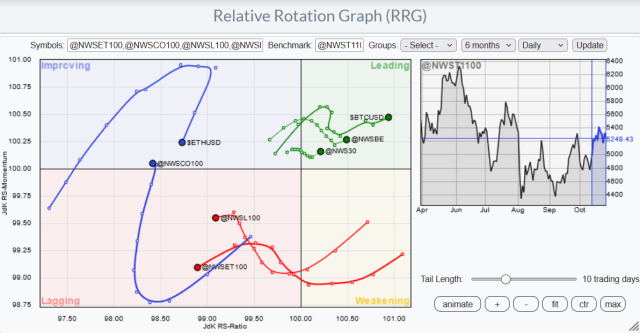
While the broader market has experienced a retracement, different segments, and individual cryptocurrencies exhibit varied performance dynamics. Bitcoin and indices NWS30 and NWSBE were leading; Ether and NWSCo100 were improving, and indices NWSL100 and NWSET100 were lagging. Investors and traders might use this information to adjust their portfolios, possibly shifting focus toward assets with stronger relative momentum while being cautious about those in the Weakening quadrant.
*RRG® charts show the relative strength and momentum of groups of digital assets. Those with strong relative strength and momentum appear in the green Leading quadrant. As relative momentum fades, they typically move into the yellow Weakening quadrant. If relative strength then fades, they move into the red Lagging quadrant. Finally, when momentum picks up again, they shift into the blue Improving quadrant.
Crypto (Digital Assets) compared with global equity
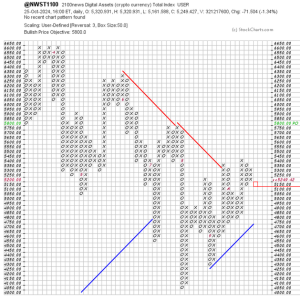
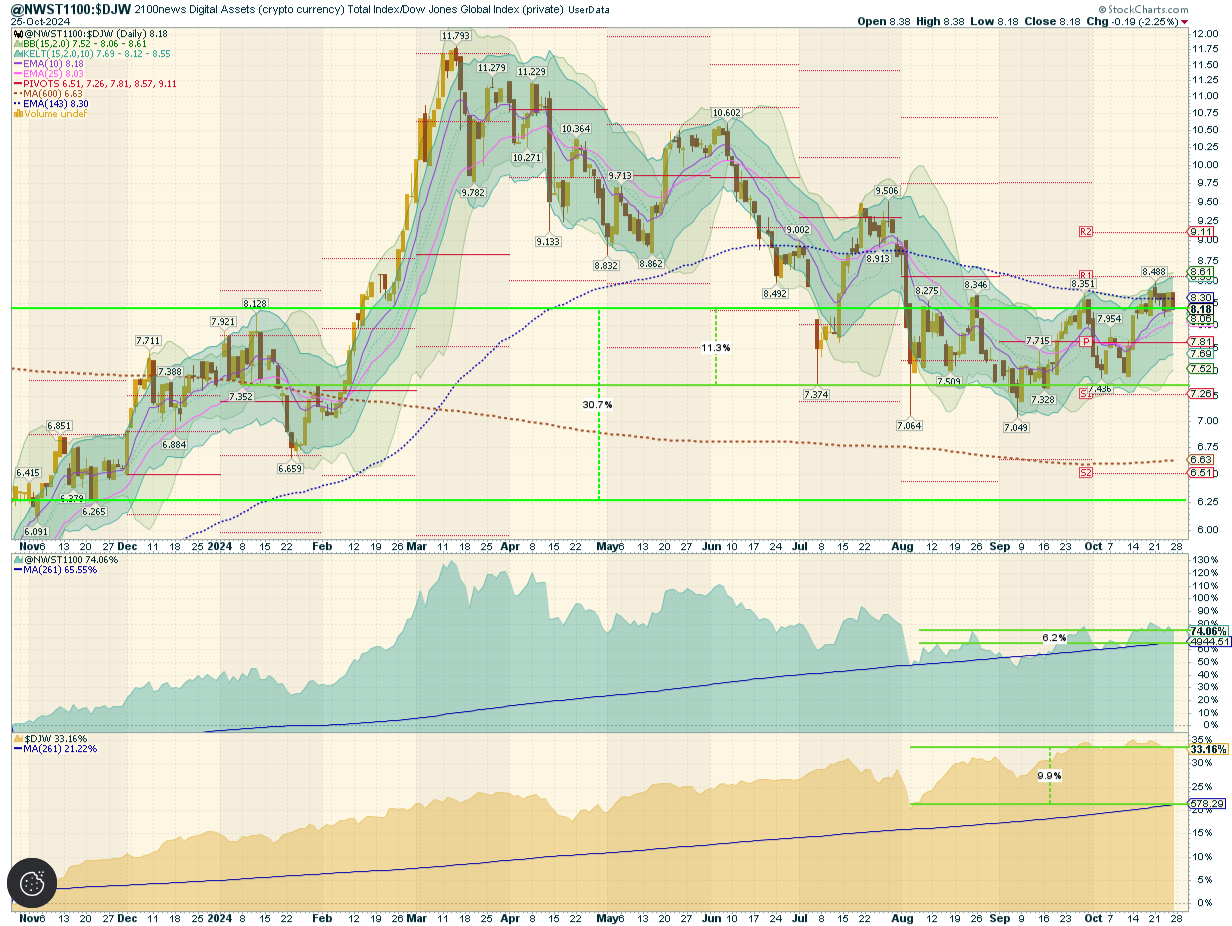
This report offers a comprehensive analysis comparing the performance of digital assets, as signified by the NWST1100 index, to shares on global capital markets, embodied by the Dow Jones Global W1Dow index. We draw insights into historical achievements and potential future trends by examining their performances over various timeframes.
Let’s break down the key observations and implications:
- Historical Performance Comparison:
- 35 Months Ago: Digital assets showcased a notable outperformance against shares in global capital markets, reaching a record high in the comparative quotient between the NWST1100 and W1Dow indexes. At this juncture, digital assets displayed a notably superior performance trajectory compared to shares on global capital markets.
- Twelve months ago, the advantage for digital assets became even more pronounced, with digital assets surpassing shares by a margin of 30.7%. This difference highlights the substantial returns that digital assets have offered over traditional shares within this timeframe.
- Mean Reversion Opportunity:
- Over the past 143 working days, the average quotient price, represented by a blue dashed curve, stands at 8.30, while the current spot price is 8.18. This is higher than the long-term mean of 6.63, which has increased since October.
- The mean reversion theory suggests that asset prices, over time, tend to revert to their historical average returns. The current average quotient price above the long-run mean could imply that digital assets are currently highly valued compared to historical trends.
- Returns Comparison:
- The chart also presents the returns achieved with the stock generated by buying one point of the respective index daily over the past twelve months.
- The NWST1100 Crypto Index enjoyed a 74.06% appreciation relative to last year’s period. With daily index investments, an investor’s stock would have seen a 6.2% uplift compared to the index’s current price. Digital assets purchased over the preceding 12 months at an average price of 4,944 points were purchased at relatively elevated levels, as they were bought during a period when markets were yielding returns of several tens of percent compared to the previous year, and prices remained above the 143-day moving average for an extended period. This highlights the importance of timing in making purchases, suggesting that, for more substantial investment potential moving forward, acquisitions should be made when the market is below the 143-day moving average, as it was this past summer and has continued until two weeks ago.
- Contrasting with the crypto index, the DJW, representing global capital market shares, grew by 33.16% over the past twelve months. However, a strategy involving daily purchases would have resulted in a gain of 9.9%.
*The box in the middle of the chart shows the original NWST1100 price; at the bottom is W1Dow.
Indices Revision 10-25-2024
Based on the latest biweekly revision, WhiteBIT Coin has improved its ranking and was added to the NWSL100 index. On the other hand, ThetaFuel was removed from the NWSL100 index. Several new mid-cap assets, including Fasttoken, DIA Token, Ark, etc., have been added to the NWSM200 index. More information about the additions and deletions for other indices in the family is available in each index’s presentation.
Winning member
Congratulations to ApeCoin (APE) for achieving a significant milestone by being recognized as the winning member of the NWSL100 crypto index with the most crucial leap in rank within the NWSL100 crypto index.
*We elect the member of the NWSL100 crypto index with the most significant jump in our ranking. We will examine how the market rates the project’s progress in case of price changes. It seems important to us whether the project is out of the ordinary tide of crypto project prices. Peer comparison should be efficient and effective, considering an investor’s point of view.
ApeCoin (APE) Website: https://apecoin.com/
APE Large-cap Ethereum-based Token is 62nd in the 2100NEWS ranking. It is an Index member: NWST1100, NWSL100, NWSTo100, and NEWSET100
2100NEWS DA Orderbook Quality Evaluation Grade: Ordinary, 20.4 (Average for Large-caps: 18.2)
Over the last week, the average market cap was $824.8 million, and the average daily volume was $330.3 million.
The APE Foundation is the steward of ApeCoin. It is not an overseer but the base layer on which ApeCoin holders in the ApeCoin DAO can build. The Foundation facilitates decentralized and community-led governance and is designed to become more decentralized over time. It is tasked with administering the decisions of the ApeCoin DAO. It is responsible for day-to-day administration, bookkeeping, project management, and other tasks that ensure the DAO community’s ideas have the support they need to become a reality. The goal of the APE Foundation is to steward the growth and development of the APE ecosystem fairly and inclusively. It utilizes the Ecosystem Fund, controlled by a multi-sig wallet, to pay its expenses as directed by the ApeCoin DAO. It also provides an infrastructure for ApeCoin holders to collaborate through open and permissionless governance processes.
 Litecoin