


2100NEWS WEEKLY CRYPTO REPORT Aug-25

The NWST1100 index has risen 0.27% from the previous week. THORChain (RUNE), a Large-cap Non-Ethereum-based Token, is biweekly making the most significant leap in rank within the NWSL100 crypto index.
*Below, we present a standardized weekly report and next week’s outlook, prepared based on the Theory Swingtum of intelligent finance. We gauge the crypto market’s breadth and direction by showing charts 2100NEWS Digital Assets Total Index (NWST1100), which measures 1100 (by market capitalization) significant crypto assets’ performance. The information-laden chart is difficult to read initially, but the chart shows essential price information, crucial decisive price levels, momentum, trading volumes, and crypto market breadth.
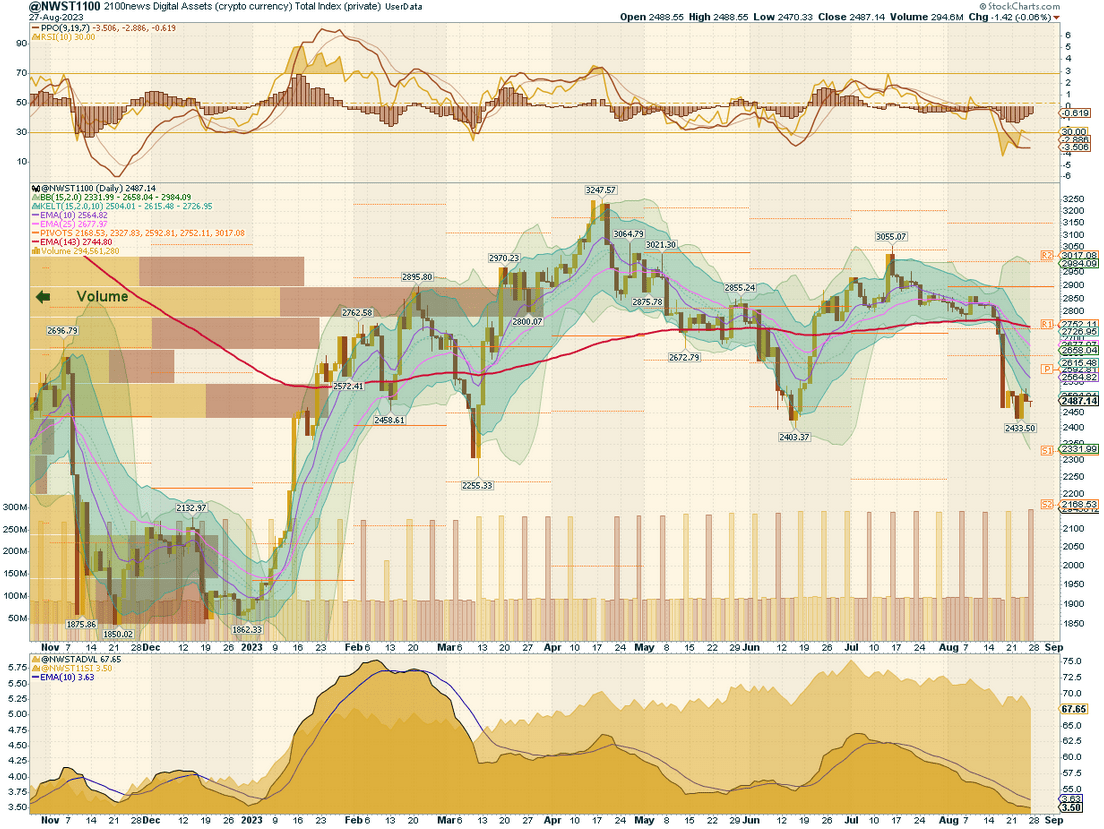
 This report will conduct a more detailed analysis of the NWST1100 chart, a critical benchmark index, by examining various indicators to gain insights into the prevailing market sentiment and breadth.
- Observing the NWST1100 index price movement, we note a consolidation after a recent decline two weeks ago.
- Market sentiment: Market sentiment analysis reveals several noteworthy points. The Percentage Price Oscillator (PPO) lines have flattened, indicating a potential stabilization or pause in the price movement. On Tuesday, the PPO histogram rebounded, suggesting renewed momentum. The Relative Strength Index (RSI) has rebounded, indicating that the market might have been oversold, and there could be a shift in sentiment.
- Shifting our focus to the Crypto Market Breadth indicators at the bottom of the NWST1100 chart, a declining market breadth is evident. The Advance-Decline Line (ADVL), which reflects the difference between the number of advancing and declining cryptocurrencies, has been consistently descending. This decline in the ADVL implies that more cryptocurrencies are declining than advancing, indicating a bearish breadth within the market. The McClellan Summation Index, also on the decline, further supports the negative breadth, substantiating the overall bearish sentiment.
Considering these insights, it’s clear that the current sentiment in the cryptocurrency market is leaning towards change. The market is witnessing consolidation and a reduction in market breadth. However, the PPO histogram and RSI rebound could indicate that investors are regaining confidence.

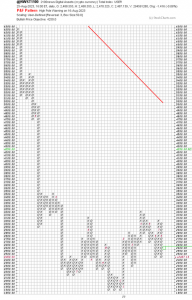
The chart on the right shows that all four A50R lines are currently oversold. This breadth indicator measures the percentage of digital assets trading above a 50-day moving average. The current oversold condition suggests that a substantial portion (over 85%) of the cryptocurrency market is presently trading below its 50-day EMA (Exponential Moving Average). Investors and traders typically pay close attention to oversold conditions.
*This breadth indicator is essential in measuring the internal strength or weakness of the underlying index. Looking at the chart on the right side, we can see the A50R lines for four different categories of digital assets:
- The top box shows the A50R lines for 100 Large-cap members of NWSL100.
- The middle box displays the A50R lines for 1100 members of NWST1100, which is the Total Index measuring the performance of significant crypto assets based on market capitalization.
- The third box shows the A50R lines for 100 Ethereum Tokens members of NWSET100.
- The bottom box represents the A50R lines for 100 Coins members of NWSCo100.
Outlook for this week
This report aims to provide insights into the cryptocurrency market’s near-term outlook. While complete predictability remains challenging, the market waves show some degree of predictability with discernible patterns in market behavior. By examining momentum indicators, several signals emerge that offer insights into the potential direction of the market in the short term.
- Recently, the market has experienced a consolidation after a decline, leading to the testing of key support levels again. This price action provides critical clues about the market sentiment and potential future trends.
- The RSI (Relative Strength Index) currently stands at 30, indicating that the market might have been oversold. RSI leaving the oversold region could suggest a potential shift in market sentiment.
- The Percentage Price Oscillator (PPO) histogram may continue rising. A rising histogram could indicate strengthening momentum. The PPO is a trend-following momentum indicator that measures the percentage difference between two moving averages.
- The Breadth indicators at the bottom of the first chart (NWST1100) may change direction. The McClellan Summation Index is a long-term market breadth indicator relying on the McClellan Oscillator. The oscillator bars above zero suggest a bullish momentum, indicating that the market breadth may favor increasing assets. This bearish pressure is anticipated to reach a level in a few days where trend reversals occurred in prior instances. Judging by the duration of this pressure, as reflected in the chart’s histogram, a gradual rise is expected by the month’s end.
Considering this analysis, we have some signs of a trend reversal and the beginning of an uptrend (RSI leaving the oversold region, PPO histogram rising towards zero). However, on the contrary, the consolidation pattern following the decline is slow-paced. It is more likely that the bottom has been reached if the consolidation pattern resembles those in March or June. This suggests a short-term rise at the end of the month.
Performance of various groups of Digital Assets (Coins and Tokens)
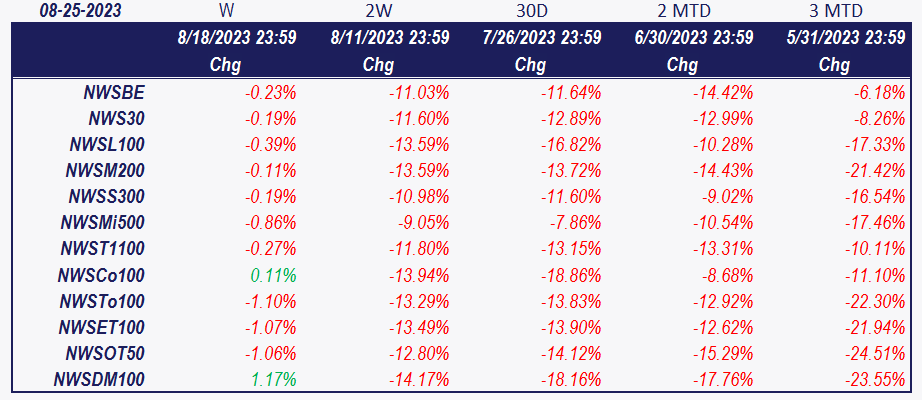
After analyzing the data in the table, the overall index NWST1100 has fallen by 0.27% over the past week. The accompanying chart illustrates the performance of several cryptocurrencies, including Bitcoin and Ether, as well as key 2100NEWS Indices, which measure the performance of tracking different segments of the market: Ethereum-based tokens (NWSET100), Large caps (NWSL100), and Coins (NWSCo100). A retrospective view over the last thirty days indicates that Bitcoin has exhibited the most favorable performance. However, this performance has still decreased by 11.22% over this period.
Crypto (Digital Assets) compared with global equity
These comparisons provide insights into the relative performance of digital assets and traditional stocks over different time periods.
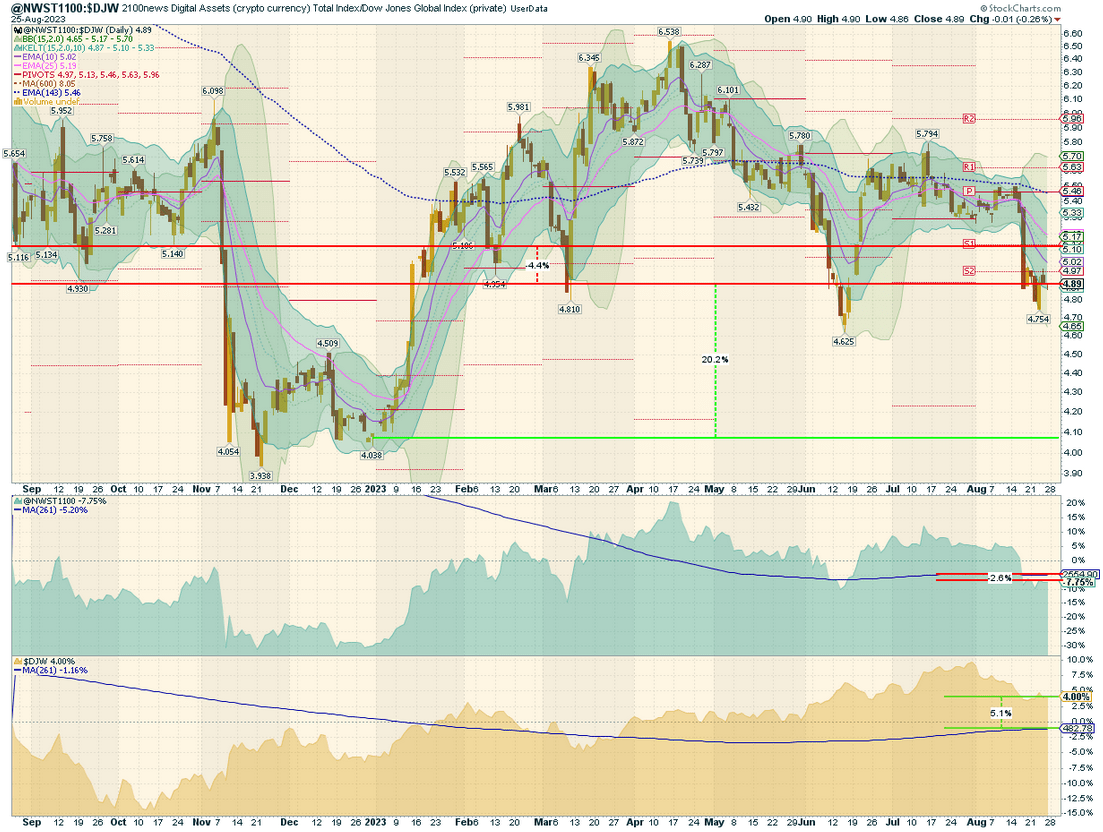
The comparison highlights the performance differences between digital assets (coins, tokens) and traditional stocks; the NWST1100 represents digital assets, while the Dow Jones Global W1Dow index represents traditional stocks. Here are the key observations:
- Historical Performance Comparison:
- 21 Months Ago: Digital assets, represented by the NWST1100 index, were outperforming traditional stocks, represented by the W1Dow index, with a record high quotient between the two indexes. This suggests that investing in digital assets was more profitable during that period compared to traditional stocks.
- 12 Months Ago: However, over the past 12 months, digital assets have lagged behind traditional stocks by 4.4%. This indicates that conventional stocks have delivered better returns than digital assets during this specific time frame.
- Recent Shift in Performance:
- In the current year, there has been a noticeable shift in performance, with digital assets outperforming traditional stocks by a significant margin of 20.2%. This suggests a potential resurgence in the performance of digital assets and a change in investor sentiment toward the cryptocurrency market.
- Mean Reversion Opportunity:
- The chart includes a blue dashed curve representing the average quotient price over 143 working days. This average has been lower than the long-run mean at 8.05. This observation hints at a potential buying opportunity for digital assets based on the mean reversion theory.
- The mean reversion theory suggests that asset prices, over time, tend to revert to their historical average returns. The fact that the current average quotient price is below the long-run mean could imply that digital assets are currently undervalued compared to historical trends.
- Returns Comparison:
- The chart also presents the returns achieved with the stock price generated by buying one point of the respective index daily over the past twelve months.
- The NWST1100 Crypto Index experienced a 7.75% loss compared to a year ago. Additionally, the purchased stock of the index achieved a 2.6% decrease compared to the index’s current price.
- In contrast, the DJW Capital Index (traditional stocks) experienced a 4.0% gain compared to a year ago. It achieved a 5.1% return on the purchased stock of the index based on daily purchases.
*The box in the middle of the chart shows the original NWST1100 price; at the bottom is W1Dow.
Indices Revision 8-25-2023
Based on the latest Bi-weekly revision, GateToken, Nexo, and APENFT have improved their ranking and were added to the NWSL100 index; they were previously included in the NWSM200 index. On the other hand, Worlcoin, Ravencoin, and ThetaFuel were removed from the NWSL100 index. Several new mid-cap assets have been added to the indices, including Sei, DeFiChain, Bluzelle, etc. More information about the additions and deletions for other indices in the family is available in each index’s presentation.
Winning member
Congratulations to THORChain (RUNE) for achieving a remarkable milestone as the winning member of the NWSL100 crypto index with the most significant leap in rank within the NWSL100 crypto index. Let’s delve into the details of its performance:
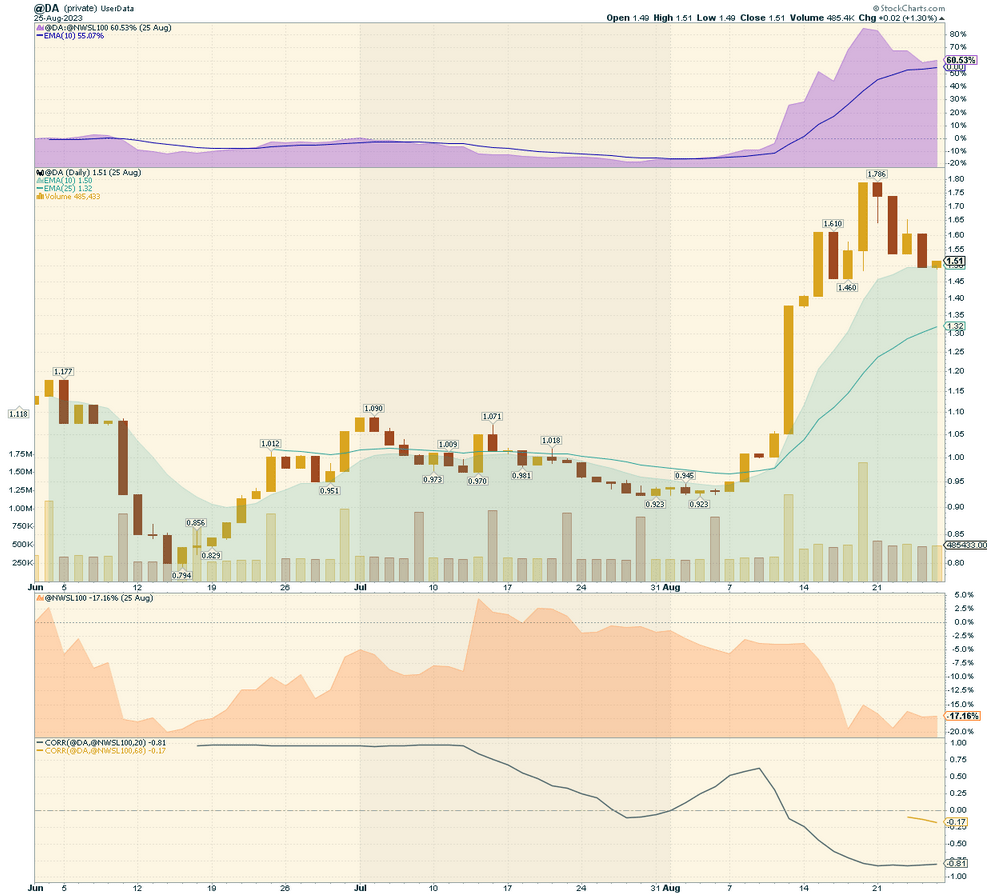
- Outperformance in the Last Ten Weeks: THORChain (RUNE) has displayed remarkable growth by substantially outperforming the 2100NEWS Digital Assets 100 Large Cap Index (NWSL100). Over the last ten weeks, RUNE has outperformed the NWSL100 index by an impressive 60%, a trend clearly depicted by the violet area chart.
- RUNE vs. NWSL100: A comparison of RUNE‘s performance with the NWSL100 index reveals interesting insights. The green area graph represents RUNE‘s performance, while the orange area graph illustrates the index’s performance. Notably, there has been a weak and negative correlation between RUNE and NWSL100, with a Pearson’s correlation coefficient of -0.17. RUNE has moved in the same direction as the index about 70% of the time.
- Divergence in Price Changes: Despite the tendency to move in tandem with NWSL100 most of the time, RUNE has not been a reliable representative of the index regarding price changes. This suggests that RUNE‘s price movements have not fully aligned with the broader market represented by NWSL100. This divergence indicates that RUNE‘s price dynamics have been influenced by other factors or unique market conditions, setting it apart from the general trends observed in the market.
*We elect the member of the NWSL100 crypto index with the most significant jump in our ranking. We will examine how the market rates the project’s progress in case of price changes. It seems important to us whether the project is out of the ordinary tide of crypto project prices. Peer comparison should be efficient and effective, considering an investor’s point of view.

THORChain (RUNE) Website: https://thorchain.org/
RUNE Large-cap Non-Ethereum-based Token is 53rd in the 2100NEWS ranking. It is an Index member: NWST1100, NWSL100, NWSTo100, NWSOT50
2100NEWS DA Orderbook Quality Evaluation Grade: Good, 22 (Average for Large-caps: 18.5)
Over the last week, the average market cap was $500.9 million, and the average daily volume was $73.4 million.
THORChain is a decentralized exchange protocol designed to power the next generation of digital asset exchanges, wallets, and payment services. It is not intended to compete with any existing token, platform, or other solution. Rather, THORChain aims to bind all cryptocurrencies together with an accessible, secure, and lightning-fast bridging protocol.
*The chart below shows the RUNE compared to NWSL100 at the top, the box in the middle of the chart shows the original price, and at the bottom, we see NWSL100 and the correlation between RUNE and NWSL100.
 Lily
Lily


 Litecoin