


2100NEWS WEEKLY CRYPTO REPORT May-16

The crypto index NWST1100 rose 1.47% last week, extending its winning streak to five consecutive weeks. However, the momentum appears to be slowing. Ether has outperformed other segments, leaping 59.24% in the previous thirty days.
*Below, we present a standardized weekly report and next week’s outlook, prepared based on the Theory Swingtum of intelligent finance. We gauge the crypto market’s breadth and direction by showing charts 2100NEWS Digital Assets Total Index (NWST1100), which measures 1100 (by market capitalization) significant crypto assets’ performance. The information-laden chart is complex to read initially, but the graph shows essential price information, crucial decisive price levels, momentum, trading volumes, and crypto market breadth. Monitoring Market Sentiment and Breadth is necessary to detect early signs of trend reversals or continued strength.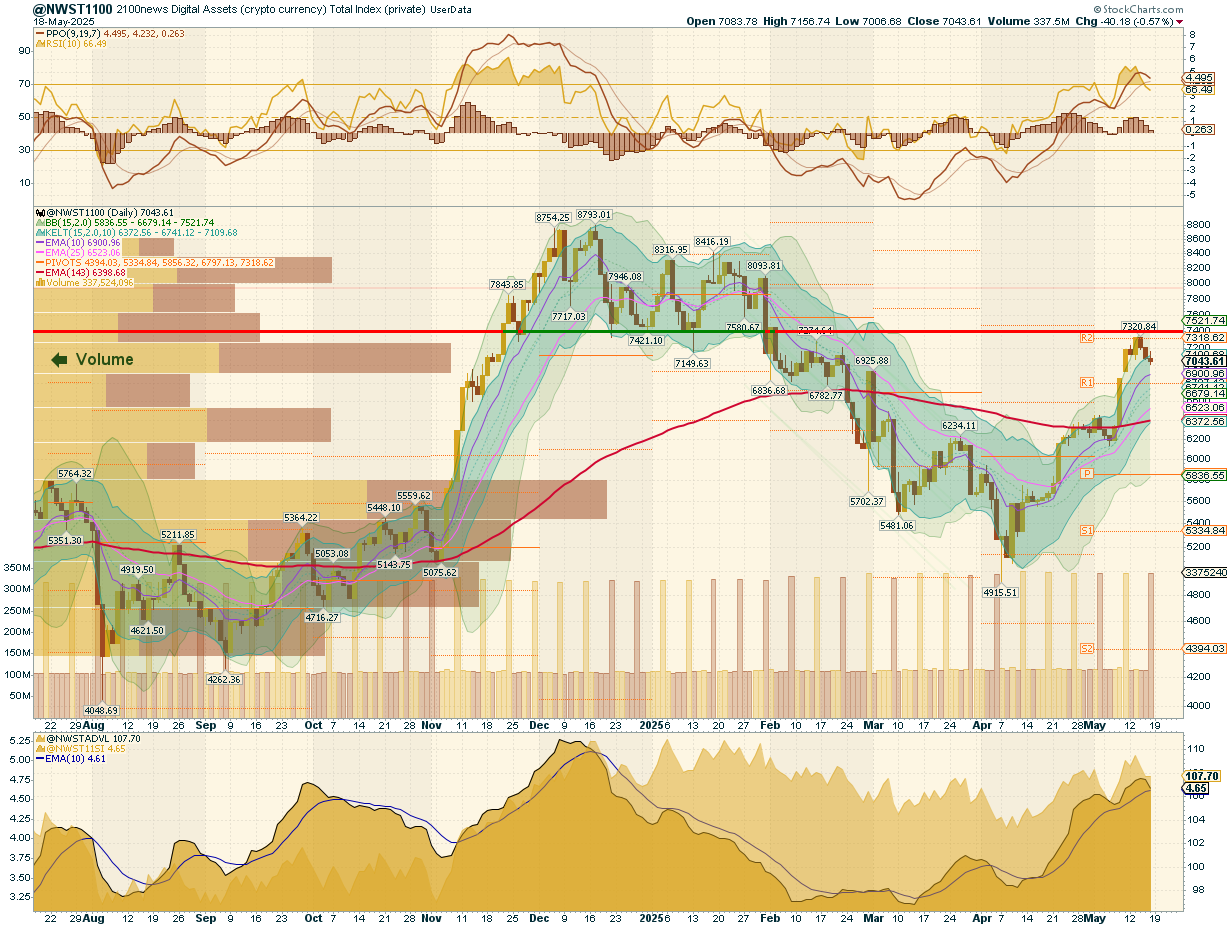

After conducting a detailed examination of the NWST1100 chart, a vital metric for the cryptocurrency market, reveals several essential market dynamics and changes in market sentiment:
The NWST1100: The index advanced by 1.47% last week, marking its fifth consecutive weekly gain. However, bullish momentum has moderated following the explosive rally sparked by Ethereum’s Pectra upgrade earlier in May. At the start of the week, the index attempted to break higher, briefly approaching the Pivot R2 zone and peaking near 7,321 points, but it failed to sustain above this resistance level. The market has since transitioned into a consolidation phase, with profit-taking dominating the final sessions of the week.
Market Sentiment (PPO & RSI): The PPO histogram has turned downward, indicating bullish momentum is fading. The PPO lines have also started to slope lower, reinforcing the view that upward momentum is losing steam. Meanwhile, the RSI remains elevated at 66.49 but has begun to decline, moving out of overbought territory and signaling increasing vulnerability to a deeper pullback.
Crypto Market Breadth indicators at the bottom of the chart further confirm a softening of market strength. The McClellan Summation Index, which tracks long-term participation trends, has started to roll over, suggesting that fewer assets participate in the rally. Similarly, the Advance-Decline Line (ADL) has turned downward, highlighting a rise in declining assets relative to advancers.

In summary, the crypto market took a breather after a powerful multi-week rally. Signs of exhaustion and a potential short-term correction have emerged. Consolidation above key support zones would be a healthy development.
According to the chart on the right, A50R indicators across all four market segments (NWST1100, NWSET100, NWSL100, NWSCo100) show a broad base of assets still trading above their 50-day averages. However, minor deterioration is visible compared to the prior week. This breadth indicator measures the percentage of digital assets trading above a 50-day moving average.
* The percentage of digital assets trading above a specific moving average is a breadth indicator that measures internal strength or weakness in the underlying index. The chart on the right side compares the percentage of DA trading above the 50-day EMA for:
- 100 Large-caps members of NWSL100 (top box)
- 1100 members of NWST1100
- 100 Ethereum Tokens members of NWSET100
- 100 Coins members of NWSCo100 (bottom box)
Outlook for this week
This report delves into the cryptocurrency market’s short-term outlook, identifying patterns and signals that could provide insights into potential market direction. While predicting market behavior is inherently uncertain, discernible trends in momentum and market breadth indicators suggest possible developments.
-
The PPO histogram, which reflects the rhythm and rate of change in market momentum, has now entered the lower half of its wave, transitioning into negative territory. Historically, this phase tends to last at least a week, as seen in early October, and typically signals a fading trend. This suggests that PPO lines may continue falling, weakening the momentum structure.
-
The RSI (Relative Strength Index), currently at 67, has begun to drift lower from its recent peak, reinforcing the case for a short-term cooling phase or minor retracement.
- The Breadth indicators at the bottom of the first chart (NWST1100) and the rising McClellan Summation Index on the chart below may extend the falling period.
In conclusion, the market appears to be entering a short-term consolidation phase, with exhausted momentum and declining breadth. The downward trajectory of the PPO lines, triggered by negative histogram bars, supports this outlook. The depth of the correction will largely depend on the market’s ability to hold support at the 10-day EMA, which coincides with the 0.78 Fibonacci retracement level. If this support holds, it may serve as a springboard for a swift rebound and trigger the formation of a sideways range-trending phase, where the market oscillates within a well-defined horizontal channel. However, if the 0.78 Fib level fails, the correction could deepen toward the 25-day EMA zone, serving as the next support. Either way, this phase will likely define the next leg’s structure, whether it’s a base for continuation or a broader reversion.
📍 Key levels to watch:
Support: 6850 (10-day EMA / 0.78 Fib)
Deeper support: 6550 (25-day EMA )

Performance of different groups of Digital Assets (Coins and Tokens)

Investors and traders often rely on historical performance data to make informed decisions about their cryptocurrency holdings. After analyzing the data in the table, it can be seen that the crypto market encountered resistance around 7400 points marked with a red-green line after a five-week climb, and the overall index has increased by 1.47% over the last week.  The chart above highlights the performance of various cryptocurrencies, such as Bitcoin, Ether, and the 2100NEWS Indices, which represent the performance of Ethereum-based tokens (NWSET100), Large caps (NWSL100), and Coins (NWSCo100). Ether held up better than other segments and has significantly outperformed other segments, leaping 59.24% in the previous thirty days.

While the broader market has consolidated, different segments and individual cryptocurrencies exhibit different performance dynamics.
Performance Trends by Market Segment:
✔ Ether led the market with exceptional gains,
✔ NWSET100 (Ethereum-based tokens), NWSCo100 (Coins), NWS30, and NWSL100 (Large Caps) improved, showing relative strength.
✔ NWSBE weakened, indicating declining strength.
✔ Bitcoin lagged.
Investors and traders might use this information to adjust their portfolios, possibly shifting focus toward assets with stronger relative momentum while being cautious about those in the Weakening quadrant.
*RRG® charts show the relative strength and momentum of groups of digital assets. Those with strong relative strength and momentum appear in the green Leading quadrant. As relative momentum fades, they typically move into the yellow Weakening quadrant. If relative strength then fades, they move into the red Lagging quadrant. Finally, when momentum picks up again, they shift into the blue Improving quadrant.
Crypto (Digital Assets) compared with global equity
This report offers a comprehensive analysis comparing the performance of digital assets, as signified by the NWST1100 index, to shares on global capital markets, as represented by the Dow Jones Global W1Dow index. The comparison spans various timeframes, offering insights into historical and recent performances and potential future trends.
Let’s break down the key observations and implications:
- Historical Performance Comparison:
- 42 Months Ago: Digital assets showcased a notable outperformance against shares in global capital markets, reaching a record high in the comparative quotient between the NWST1100 and W1Dow indexes. At this juncture, digital assets displayed a notably superior performance trajectory compared to shares on global capital markets.
- Twelve months ago to Present, digital assets have outperformed equities by 14.8%.
- Mean Reversion Opportunity:
- Over the past 143 working days, the average quotient price, represented by a blue dashed curve, stands at 10.11, while the current spot ratio is 10.74. This is higher than the long-term mean of 7.89, which has increased since October.
- The mean reversion theory suggests that asset prices tend to revert to their historical average returns over time. The current average quotient price above the long-run mean could imply that digital assets are still trading at a relative premium to historical trends.
- Returns Comparison:
- The chart also presents the returns achieved by the simplified index-based accumulation approach—buying one index point per day over 12 months—to simulate a mechanical exposure build-up. While this method is not equivalent to classical dollar-cost averaging (which involves investing a fixed amount of capital daily), it offers a consistent benchmark to compare historical costs and returns. The NWST1100 Crypto Index has risen by 9.77% from twelve months ago. With daily index investments, an investor’s stock price would have resulted in a gain of 15.6% on the current index price, reflecting unprofitable purchases due to high entry prices during a prolonged market uptrend when prices remained above the 143-day moving average for an extended period.
- The DJW, representing global capital market shares, has risen 10.37% over the past twelve months. However, a strategy involving daily purchases would have resulted in a gain of 5.7%.
- Conclusion:
*The box in the middle of the chart shows the original NWST1100 price; at the bottom is W1Dow.


 Litecoin