


2100NEWS WEEKLY CRYPTO REPORT Jan-17

The NWST1100 index leaped 11.09% from the previous week. XDC Network (XDC), a large-cap Non-Ethereum-based Token, has biweekly made the most significant leap in rank within the NWSL100 crypto index.
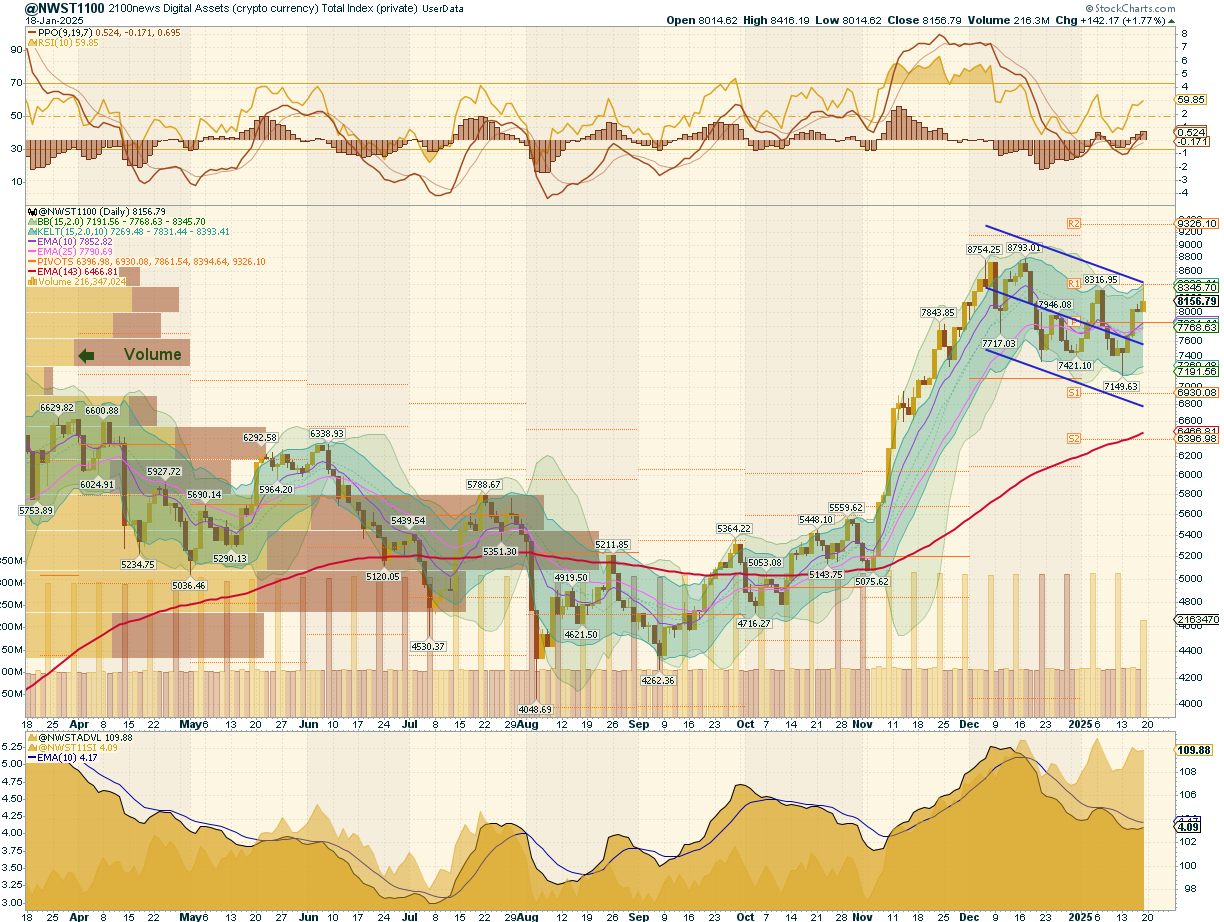
*Below, we present a standardized weekly report and next week’s outlook, prepared based on the Theory Swingtum of intelligent finance. We gauge the crypto market’s breadth and direction by showing charts 2100NEWS Digital Assets Total Index (NWST1100), which measures 1100 (by market capitalization) significant crypto assets’ performance. The information-laden chart is complex to read initially, but the chart shows essential price information, crucial decisive price levels, momentum, trading volumes, and crypto market breadth. Monitoring Market Sentiment and Breadth is necessary to detect early signs of trend reversals or continued strength.
 Our detailed analysis of the NWST1100 chart and related market indicators reveals essential insights into the current market conditions:
The NWST1100’s analysis shows a robust rally after testing its lowest point of the year on Monday. This recovery mirrors the renewed optimism and broader upward sentiment in the cryptocurrency markets.
- Market sentiment: The Price Oscillator (PPO) lines and the histogram have moved upward, signaling a strengthening upward momentum. The RSI (Relative Strength Index) has trended upward, reflecting increasing buying pressure and optimism.
- We are now focusing on the breadth indicators at the bottom of the NWST1100 chart. The Advance-Decline Line (ADVL), which measures the number of advancing versus declining assets, has flattened. This indicates a balance between advancing and declining assets and suggests a steady recovery without excessive market overextension. Similarly, the falling McClellan Summation Index, a long-term version of the McClellan Oscillator that measures market breadth, has flattened.
These indicators collectively reveal a broad rebound in the cryptocurrency market, driven by bullish momentum. However, the stabilizing breadth indicators signal a balanced market, hinting at potential consolidation in the near term.
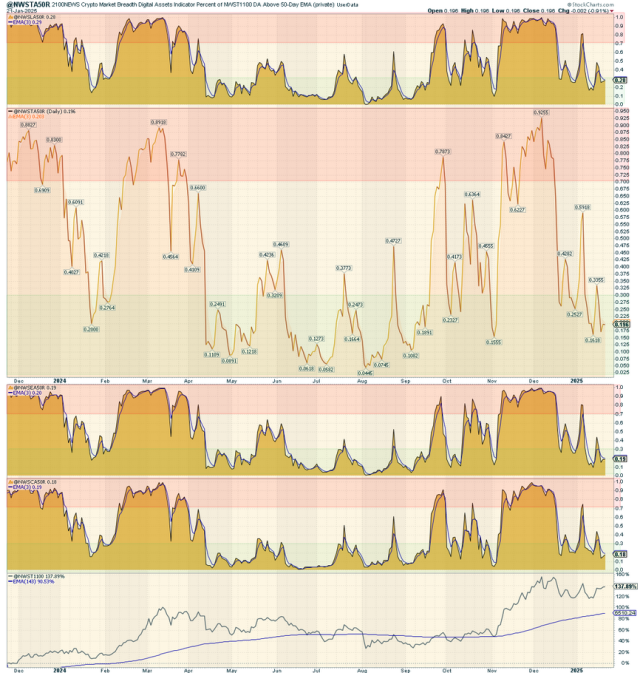
According to the chart on the right, all A50R lines were oversold, with over 70% of cryptocurrencies below their 50-day moving averages, underscoring the market’s previous bearish conditions. This breadth indicator measures the percentage of digital assets trading above a 50-day moving average.
*This breadth indicator is essential in measuring the internal strength or weakness of the underlying index. Looking at the chart on the right side, we can see the A50R lines for four different categories of digital assets:
- The top box shows the A50R lines for 100 Large-cap members of NWSL100.
- The middle box displays the A50R lines for 1100 members of NWST1100, which is the Total Index measuring the performance of significant crypto assets based on market capitalization.
- The third box shows the A50R lines for 100 Ethereum Tokens members of NWSET100.
- The bottom box represents the A50R lines for 100 Coins members of NWSCo100., tako
Outlook for this week
This report aims to provide insights into the cryptocurrency market’s near-term outlook. While complete predictability remains challenging, the market waves show some degree of predictability with discernible patterns in market behavior. By examining momentum indicators, several signals emerge that offer insights into the potential direction of the market in the short term.
- The RSI (Relative Strength Index), with a current reading of 60, lies within the neutral zone and shows dominant buying pressure and a bullish sentiment in the market. However, such levels indicate limited downside potential.
- The PPO lines measure the market’s momentum and may continue in this direction. However, profit-taking could drive a swift, temporary downward correction.
- The Breadth indicators at the bottom of the first chart (NWST1100), which reflect the participation of assets in the market movement, may suggest that the decrease in involvement is slowing. This could indicate stabilization or early signs of a recovery in progress, with opportunities for continued growth.
In conclusion, the market is poised for potential short-term volatility. The correction phase reflects cautious sentiment and selling pressure, but stabilization and recovery are likely to follow. While risks of profit-taking and temporary corrections remain, opportunities for continued growth appear promising as market participation strengthens and bullish momentum builds.

Investors and traders often rely on historical performance data to make informed decisions about their cryptocurrency holdings. After analyzing the data in the table, the overall index has leaped 11.09% over the last week.  The chart above highlights the performance of key cryptocurrencies, such as Bitcoin and Ether, alongside the 2100NEWS Indices, which track the performance of Ethereum-based tokens (NWSET100), large caps (NWSL100), and Coins (NWSCo100).
Coins represented by the NWSC100 index have outperformed other segments, with a gain of 18.02% in the previous thirty days.
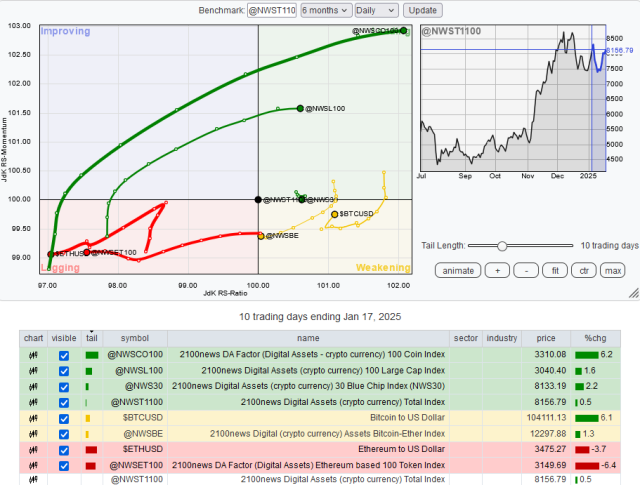
While the broader market has experienced a rally, different segments, and individual cryptocurrencies exhibit almost the same performance dynamics. NWSCo100, NWSL100, and NWS30 were leading, Bitcoin and NWSBE were weakening, and NWSET100 and Ether lagged. Investors and traders might use this information to adjust their portfolios, possibly shifting focus toward assets with stronger relative momentum while being cautious about those in the Weakening quadrant.
*RRG® charts show the relative strength and momentum of groups of digital assets. Those with strong relative strength and momentum appear in the green Leading quadrant. As relative momentum fades, they typically move into the yellow Weakening quadrant. If relative strength then fades, they move into the red Lagging quadrant. Finally, when momentum picks up again, they shift into the blue Improving quadrant.
Crypto (Digital Assets) compared with global equity
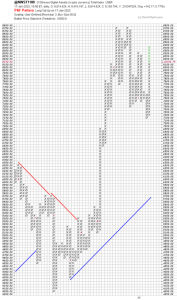
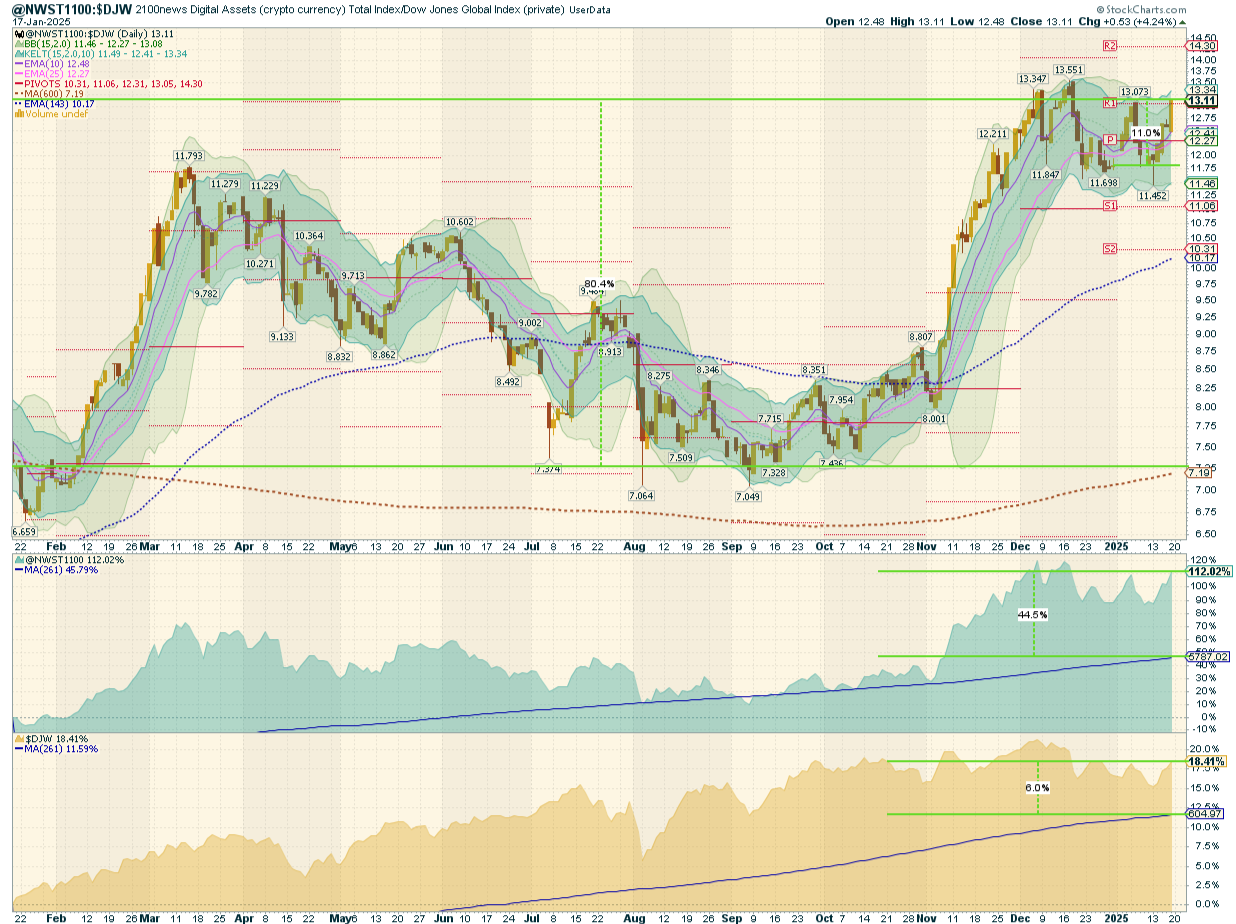
This report offers a comprehensive analysis comparing the performance of digital assets, as signified by the NWST1100 index, to shares on global capital markets, embodied by the Dow Jones Global W1Dow index. We draw insights into historical achievements and potential future trends by examining their performances over various timeframes.
Let’s break down the key observations and implications:
- Historical Performance Comparison:
- 38 Months Ago: Digital assets showcased a notable outperformance against shares in global capital markets, reaching a record high in the comparative quotient between the NWST1100 and W1Dow index. At this juncture, digital assets displayed a notably superior performance trajectory compared to shares on global capital markets.
- Twelve months ago, the advantage for digital assets became even more pronounced, surpassing shares by a margin of 80.4%. This difference highlights the substantial returns that digital assets have offered over traditional equity investments within this timeframe.
- Mean Reversion Opportunity:
- The average quotient price, represented by a blue dashed curve, has been 10.17 over the past 143 working days, while the current spot price is 13.11. This is higher than the long-term mean of 7.19, which has increased since October.
- The mean reversion theory suggests that asset prices, over time, tend to revert to their historical average returns. The current average quotient price above the long-run mean could imply that digital assets are currently highly valued compared to historical trends.
- Returns Comparison:
- The chart also presents the returns achieved with the stock generated by buying one point of the respective index daily over the past twelve months.
- The NWST1100 Crypto Index enjoyed a 112.02% appreciation relative to last year’s period. With daily index investments, an investor’s stock price (5,787) would have been lower than the current index price, resulting in a 44.5% profit. Digital assets purchased over the preceding 12 months at an average price of 5,787 points were purchased at relatively elevated levels, as they were bought during a period when markets were yielding returns of several tens of percent compared to the previous year, and prices remained above the 143-day moving average for an extended period. The strong rally in November has made these relatively expensive purchases profitable. However, for more substantial investment potential, acquisitions should ideally be made when the market is below the 143-day moving average, as it was this past summer and continued until two months ago.
- Contrasting with the crypto index, the DJW, representing global capital market shares, grew by 18.41% over the past twelve months. However, a strategy involving daily purchases would have resulted in a gain of 6.0%.
*The box in the middle of the chart shows the original NWST1100 price; at the bottom is W1Dow.
Indices Revision 1-17-2025
Based on the latest biweekly revision, Sonic and XDC Network improved their ranking and were added to the NWSL100 index. On the other hand, FTX Token and Synthetix were removed from the NWSL100 index. Several new mid-cap assets, including ai16z, GRIFFAIN, DeepBook, etc., have been added to the NWSM200 index. Each index’s presentation provides more information about the additions and deletions for other indices in the family.
Winning member
Congratulations to XDC Network (XDC) on achieving a significant milestone: being recognized as the winning member of the NWSL100 crypto index, which represents the most crucial leap in rank within the index.
*We elect the member of the NWSL100 crypto index with the most significant jump in our ranking. We will examine how the market rates the project’s progress in case of price changes. It seems important to us whether the project is out of the ordinary tide of crypto project prices. Peer comparison should be efficient and effective, considering an investor’s point of view.
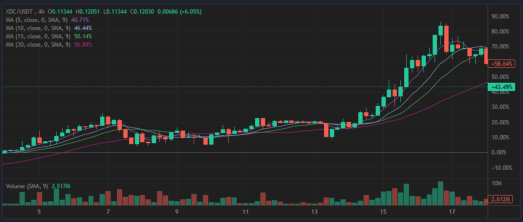
XDC Network (XDC) https://xdc.org/
XDC Large-cap Non-Ethereum-based Token is 91st in the 2100NEWS ranking. It is an Index member: NWST1100, NWSL100, and NWSCo100
2100NEWS DA Orderbook Quality Evaluation Grade: Poor, 10.6 (Average for Large-caps: 18)
Over the last week, the average market cap was $1,786.3 million, and the average daily volume was $87.8 million.
XinFin is an enterprise-ready hybrid BlXinFin technology company optimized for international trade and finance. The XinFin network is powered by the native coin called XDC. The XDC protocol is architected to support smart contracts, 2000TPS, 2 seconds transaction time, and KYC to Masternodes (Validator Nodes). The XDC Chain (XinFin Digital Contract) uses XinFin Delegated Proof of Stake (XDPoS), intending to create a highly scalable, secure, permission, and commercial-grade blockchain network. XinFin mainnet token XDC also creates an opportunity to utilize XinFin’s real-world use cases, such as TradeFinex.org, which helps small and medium businesses or institutions originate their own financial requirements in a digital, fully structured manner so that they can distribute them to the bank or non-bank funders themselves using a common distribution standard.


 Litecoin