


2100NEWS WEEKLY CRYPTO REPORT Dec-20

The NWST1100 index plunged 8.47% from the previous week. Hyperliquid (HYPE), a large-cap Coin, has biweekly made the most significant leap in rank within the NWSL100 crypto index.
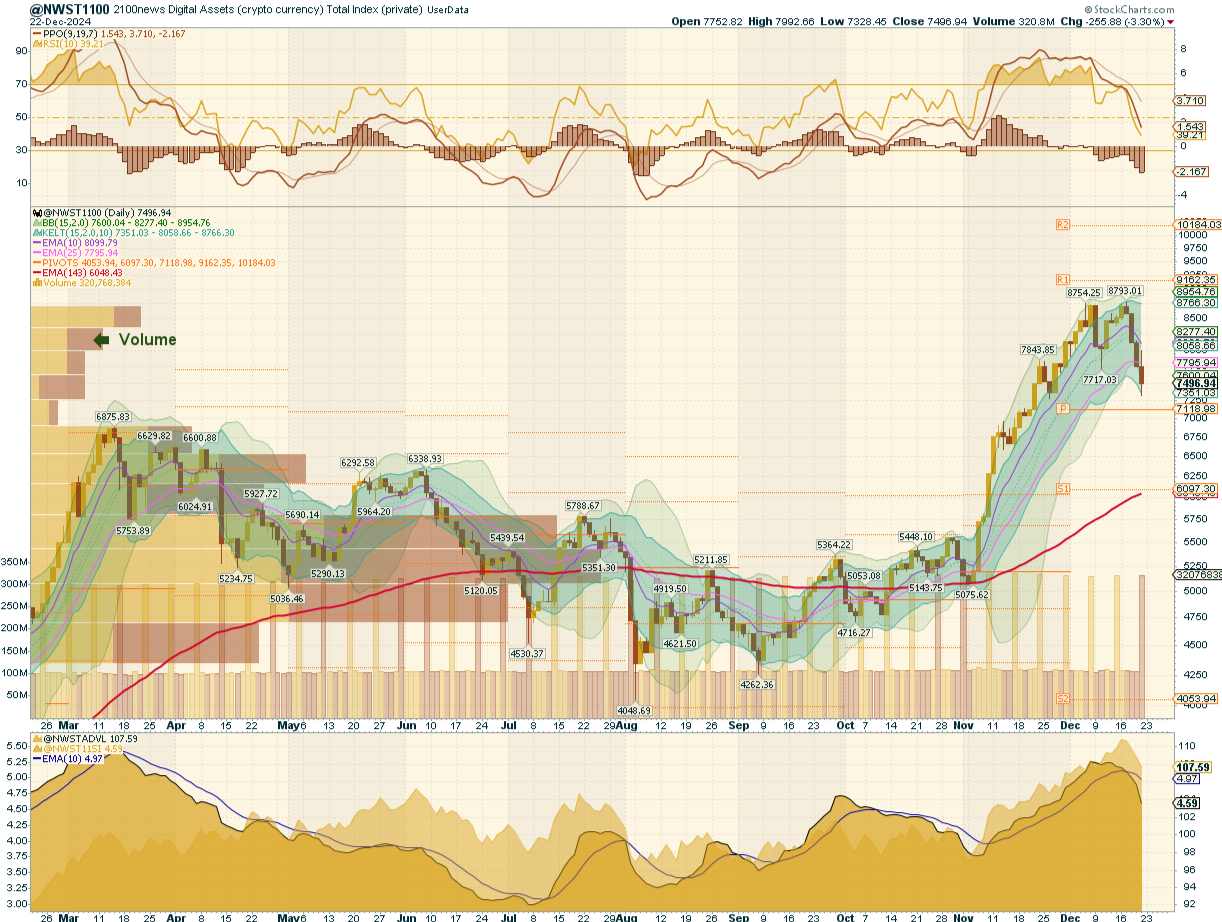
*Below, we present a standardized weekly report and next week’s outlook, prepared based on the Theory Swingtum of intelligent finance. We gauge the crypto market’s breadth and direction by showing charts 2100NEWS Digital Assets Total Index (NWST1100), which measures 1100 (by market capitalization) significant crypto assets’ performance. The information-laden chart is complex to read initially, but the chart shows essential price information, crucial decisive price levels, momentum, trading volumes, and crypto market breadth. Monitoring Market Sentiment and Breadth is necessary to detect early signs of trend reversals or continued strength.
 Our detailed analysis of the NWST1100 chart and related market indicators reveals essential insights into the current market conditions:
- The analysis of the NWST1100 has experienced a sharp pullback over the past week, reflecting strong downward momentum across the broader cryptocurrency market. This correction has been driven by significant retracements across large, mid, and small-cap categories, leading to notable declines across all market segments. The chart visualizes this movement with falling candles, underscoring sustained selling pressure.
- Market sentiment: The Price Oscillator (PPO) lines and the histogram have fallen, signaling a reduction in upward momentum and the onset of bearish conditions. The RSI (Relative Strength Index) has trended downward, moving to oversold territory and indicating weakening buying pressure.
- We are now focusing on the breadth indicators at the bottom of the NWST1100 chart. The Advance-Decline Line (ADVL), which measures the number of advancing versus declining assets, has fallen, suggesting a growing ratio of declining assets to growing ones. Similarly, the falling McClellan Summation Index, a long-term version of the McClellan Oscillator that measures market breadth, showed a downward trend.
These indicators collectively reveal a broad correction in the cryptocurrency market, driven by bearish momentum.

According to the chart on the right, all four A50R lines were oversold, with over 70% of cryptocurrencies below their 50-day moving averages. This breadth indicator measures the percentage of digital assets trading above a 50-day moving average.
*This breadth indicator is essential in measuring the internal strength or weakness of the underlying index. Looking at the chart on the right side, we can see the A50R lines for four different categories of digital assets:
- The top box shows the A50R lines for 100 Large-cap members of NWSL100.
- The middle box displays the A50R lines for 1100 members of NWST1100, which is the Total Index measuring the performance of significant crypto assets based on market capitalization.
- The third box shows the A50R lines for 100 Ethereum Tokens members of NWSET100.
- The bottom box represents the A50R lines for 100 Coins members of NWSCo100., tako
Outlook for this week
This report aims to provide insights into the cryptocurrency market’s near-term outlook. While complete predictability remains challenging, the market waves show some degree of predictability with discernible patterns in market behavior. By examining momentum indicators, several signals emerge that offer insights into the potential direction of the market in the short term.
- The RSI (Relative Strength Index), with a current reading of 39, is in the neutral zone and shows dominant selling pressure and a strong bearish sentiment in the market. However, such levels indicate limited downside potential, with the market nearing a turnaround point for correction. Following a possible dip, the RSI may rebound swiftly, suggesting that correction will likely be short-lived.
- The PPO lines measure the market’s momentum and may shift direction later in the week. If this shift aligns with other indicators signaling a reversal, the market may experience an upward change driven by renewed buying interest, which the Christmas rally could fuel.
- The Breadth indicators at the bottom of the first chart (NWST1100), which reflect the participation of assets in the market movement, may suggest that the decline in participation may be slowing, indicating early signs of stabilization in market breadth.
In conclusion, the market is poised for potential short-term volatility, driven by the recent correction and current oversold conditions. The correction phase reflects cautious sentiment and selling pressure, but oversold conditions on key indicators like the RSI suggest that the market may approach a potential stabilization or recovery zone in the near term. The traditional Christmas rally will counterbalance the negative momentum from the recent correction, although the outcome remains uncertain. Whether this results in a mere balancing at the middle of the Bollinger band or actual growth is difficult to predict. However, it is unlikely that new record highs will be achieved this year.

Investors and traders often rely on historical performance data to make informed decisions about their cryptocurrency holdings. After analyzing the data in the table, it can be seen that the overall index has plunged 8.47% over the last week. 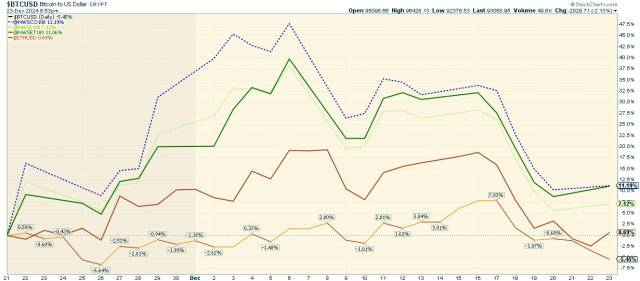 The chart above highlights the performance of various cryptocurrencies, such as Bitcoin, Ether, and the 2100NEWS Indices, which represent the performance of Ethereum-based tokens (NWSET100), Large caps (NWSL100), and Coins (NWSCo100). Coins represented by the NWSC100 index have outperformed other segments, with a gain of 11.19% in the previous thirty days.
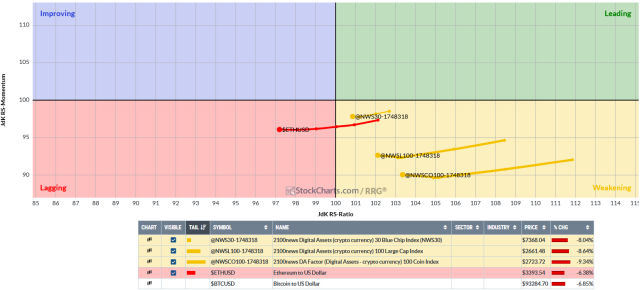
While the broader market has experienced a correction, different segments, and individual cryptocurrencies exhibit almost the same performance dynamics. NWSCo100, NWS30, NWSET100, NWSBE, and NWSL100 were weakening, and Ether lagged. Investors and traders might use this information to adjust their portfolios, possibly shifting focus toward assets with stronger relative momentum while being cautious about those in the Weakening quadrant.
*RRG® charts show the relative strength and momentum of groups of digital assets. Those with strong relative strength and momentum appear in the green Leading quadrant. As relative momentum fades, they typically move into the yellow Weakening quadrant. If relative strength then fades, they move into the red Lagging quadrant. Finally, when momentum picks up again, they shift into the blue Improving quadrant.
Crypto (Digital Assets) compared with global equity
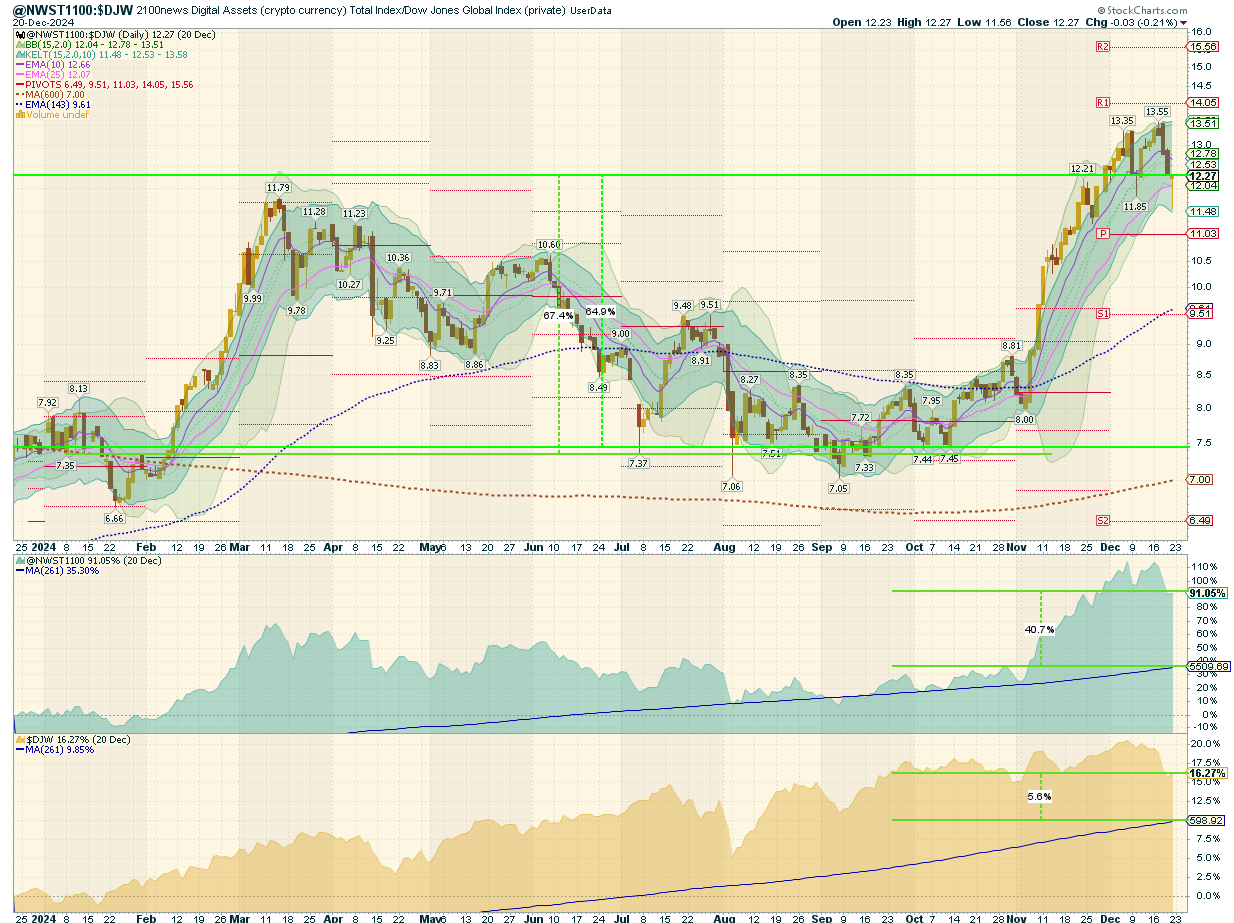
This report offers a comprehensive analysis comparing the performance of digital assets, as signified by the NWST1100 index, to shares on global capital markets, embodied by the Dow Jones Global W1Dow index. We draw insights into historical achievements and potential future trends by examining their performances over various timeframes.
Let’s break down the key observations and implications:
- Historical Performance Comparison:
- 37 Months Ago: Digital assets showcased a notable outperformance against shares in global capital markets, reaching a record high in the comparative quotient between the NWST1100 and W1Dow indexes. At this juncture, digital assets displayed a notably superior performance trajectory compared to shares on global capital markets.
- Twelve months ago, the advantage for digital assets became even more pronounced, surpassing shares by a margin of 64.9%. This difference highlights the substantial returns that digital assets have offered over traditional shares within this timeframe.
- Mean Reversion Opportunity:
- Over the past 143 working days, the average quotient price, represented by a blue dashed curve, stands at 9.61, while the current spot price is 12.27. This is higher than the long-term mean of 7.00, which has increased since October.
- The mean reversion theory suggests that asset prices, over time, tend to revert to their historical average returns. The current average quotient price above the long-run mean could imply that digital assets are currently highly valued compared to historical trends.
- Returns Comparison:
- The chart also presents the returns achieved with the stock generated by buying one point of the respective index daily over the past twelve months.
- The NWST1100 Crypto Index enjoyed a 91.05% appreciation relative to last year’s period. With daily index investments, an investor’s stock would have seen a 40.7% uplift compared to the index’s current price. Digital assets purchased over the preceding 12 months at an average price of 5,510 points were purchased at relatively elevated levels, as they were bought during a period when markets were yielding returns of several tens of percent compared to the previous year, and prices remained above the 143-day moving average for an extended period. The strong rally in November and December has made these relatively expensive purchases profitable. However, for more substantial investment potential, acquisitions should ideally be made when the market is below the 143-day moving average, as it was this past summer and continued until two months ago.
- Contrasting with the crypto index, the DJW, representing global capital market shares, grew by 16.27% over the past twelve months. However, a strategy involving daily purchases would have resulted in a gain of 5.6%.
*The box in the middle of the chart shows the original NWST1100 price; at the bottom is W1Dow.
Indices Revision 12-20-2024
Based on the latest biweekly revision, Bitget Token, Fasttoken, EigenLayer, and Hyperliquid have improved their ranking and were added to the NWSL100 index. On the other hand, NOSTALGIA, Ordinals, and Wormhole were removed from the NWSL100 index. Several new mid-cap assets, including Movement, Pudgy Penguins, USUAL, etc., have been added to the NWSM200 index. More information about the additions and deletions for other indices in the family is available in each index’s presentation.
Winning member
Congratulations to Hyperliquid (HYPE) for achieving a significant milestone by being recognized as the winning member of the NWSL100 crypto index with the most crucial leap in rank within the NWSL100 crypto index.
*We elect the member of the NWSL100 crypto index with the most significant jump in our ranking. We will examine how the market rates the project’s progress in case of price changes. It seems important to us whether the project is out of the ordinary tide of crypto project prices. Peer comparison should be efficient and effective, considering an investor’s point of view.
Hyperliquid (HYPE) Website://www.hyperfoundation.org/
HYPE Large-cap Coin is 76th in the 2100NEWS ranking. It is an Index member: NWST1100, NWSL100, and NWSCo100
2100NEWS DA Orderbook Quality Evaluation Grade: Poor, 5.6 (Average for Large-caps: 18.1)
Over the last week, the average market cap was $8,372.3 million, and the average daily volume was $473.8 million.
Hyperliquid is a cutting-edge blockchain platform designed to revolutionize decentralized finance (DeFi) with its purpose-built Layer 1 (L1) blockchain. At the heart of its innovation is the HyperBFT consensus mechanism, which delivers rapid transaction finality and robust security. Hyperliquid specializes in decentralized perpetual futures trading, offering a zero gas fee structure to reduce costs and enhance efficiency. Its standout feature is a fully on-chain order book, ensuring unparalleled transparency and security, a rarity among decentralized exchanges. Developed by a team of experts from institutions like Harvard, Caltech, and MIT, Hyperliquid is a self-funded initiative, emphasizing its independence and commitment to its vision. By combining centralized exchange (CEX)-level performance with decentralized transparency, Hyperliquid bridges critical gaps in the DeFi ecosystem, addressing scalability, cost barriers, and trust. Hyperliquid’s innovations position it as a transformative player in the blockchain space, offering a high-performance, cost-effective, and transparent platform for perpetual futures trading. While showing immense potential, individuals are encouraged to conduct thorough research to understand the risks and opportunities associated with the platform.


 Litecoin