


2100NEWS WEEKLY CRYPTO REPORT Dec-6

The NWST1100 index leaped 10.01% from the previous week. Virtuals Protocol (VIRTUAL), a large-cap Ethereum-based Token, has biweekly made the most significant leap in rank within the NWSL100 crypto index.
*Below, we present a standardized weekly report and next week’s outlook, prepared based on the Theory Swingtum of intelligent finance. We gauge the crypto market’s breadth and direction by showing charts 2100NEWS Digital Assets Total Index (NWST1100), which measures 1100 (by market capitalization) significant crypto assets’ performance. The information-laden chart is complex to read initially, but the chart shows essential price information, crucial decisive price levels, momentum, trading volumes, and crypto market breadth. Monitoring Market Sentiment and Breadth is necessary to detect early signs of trend reversals or continued strength.
 Our detailed analysis of the NWST1100 chart and related market indicators reveals essential insights into the current market conditions:
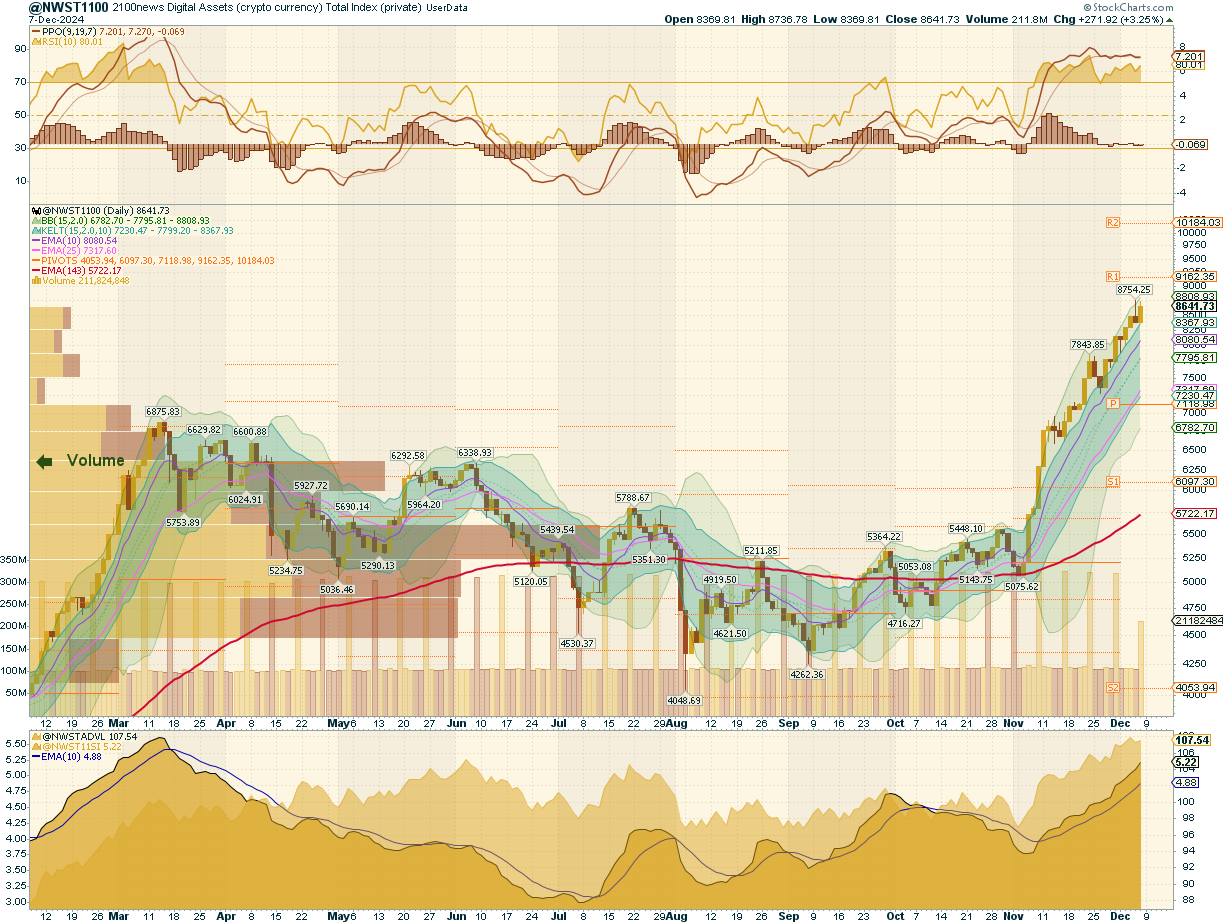
- The analysis of the NWST1100 has shown a sharp rise over the past week, reflecting strong upward momentum across the broader cryptocurrency market. This growth is driven by huge gains across large, mid, and small-cap categories over the past week and the last fourteen days. The chart represents this by a series of rising candles that followed a correction (marked by two falling candles) two weeks ago, coinciding with Bitcoin nearing the $100,000 threshold.
- Market sentiment: The Price Oscillator (PPO) lines have flattened, and the histogram remained negative, signaling reduced upward momentum. The RSI (Relative Strength Index) has been overbought and has trended sideways.
- We are now focusing on the breadth indicators at the bottom of the NWST1100 chart. The Advance-Decline Line (ADVL), which measures the number of advancing versus declining assets, has flattened, suggesting a balanced ratio of growing versus declining assets. Similarly, a rising McClellan Summation Index, a long-term version of the McClellan Oscillator that measures market breadth, showed an upward trend.
These indicators underscore a broad rally in the cryptocurrency market, driven by increasing participation and bullish momentum.
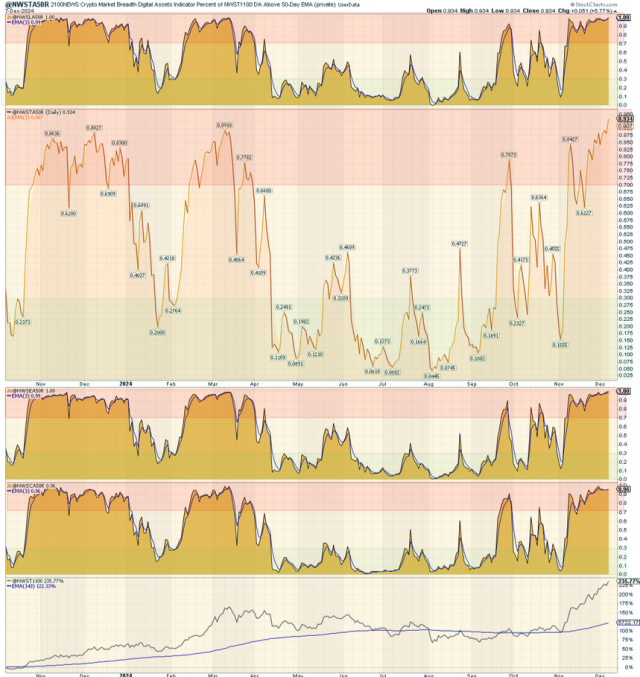
According to the chart on the right, all four A50R lines were overbought, with over 70% of cryptocurrencies above their 50-day moving averages. This breadth indicator measures the percentage of digital assets trading above a 50-day moving average.
*This breadth indicator is essential in measuring the internal strength or weakness of the underlying index. Looking at the chart on the right side, we can see the A50R lines for four different categories of digital assets:
- The top box shows the A50R lines for 100 Large-cap members of NWSL100.
- The middle box displays the A50R lines for 1100 members of NWST1100, which is the Total Index measuring the performance of significant crypto assets based on market capitalization.
- The third box shows the A50R lines for 100 Ethereum Tokens members of NWSET100.
- The bottom box represents the A50R lines for 100 Coins members of NWSCo100., tako
Outlook for this week
This report aims to provide insights into the cryptocurrency market’s near-term outlook. While complete predictability remains challenging, the market waves show some degree of predictability with discernible patterns in market behavior. By examining momentum indicators, several signals emerge that offer insights into the potential direction of the market in the short term.
- The RSI (Relative Strength Index), with a current reading of 80, is overbought and shows dominant buying pressure and a strong bullish sentiment in the market. However, such extreme levels indicate limited upside potential before the market reaches a point of correction, so the RSI may turn downward temporarily, signaling a cooling-off phase or correction. Following a possible dip, the RSI may rebound swiftly, suggesting that any correction will likely be short-lived.
- The PPO lines measure the market’s momentum and may shift direction later in the week. If this shift aligns with other indicators signaling a reversal, the market may experience a sharp spike downward. The correction will likely be followed by an immediate rebound, driven by renewed buying interest, reflecting the market’s strong underlying demand.
- The Breadth indicators at the bottom of the first chart (NWST1100), which reflect the participation of assets in the market movement, may show signs of stabilization. This implies that the rise in these indicators may be slowing, signaling buying interest and broader participation.
In conclusion, the market is poised for potential short-term volatility, driven by current overbought conditions. A brief correction is likely, with the target level near the 25-day EMA (Exponential Moving Average). Based on past market behavior, these corrections tend to be sharp and swift. However, strong underlying demand and broad market participation suggest that any dip will likely trigger immediate buying pressure, resulting in a rapid rebound.

Investors and traders often rely on historical performance data to make informed decisions about their cryptocurrency holdings. After analyzing the data in the table, it can be seen that the overall index has leaped 10.01% over the last week.  The chart above highlights the performance of various cryptocurrencies, such as Bitcoin, Ether, and the 2100NEWS Indices, which represent the performance of Ethereum-based tokens (NWSET100), Large caps (NWSL100), and Coins (NWSCo100). Money from realized profits on Bitcoin in the last two weeks flows into altcoins and tokens, contributing to a diversified rally across various market segments. The first two columns in the table show that the NWST1100 total market index is growing almost twice as fast as the NWSBE index, which represents Bitcoin and Ether. We can also see considerable gains in large, mid, and small-cap categories over the past week and the last fourteen days, which are driving the growth of the total market index in the previous fourteen days. Additionally, it can be observed that the above-average growth of coins (NWSCo100) over the past month has aligned with the rest of the tokens over the last fourteen days. Coins represented by the NWSC100 index have outperformed other segments, with a leap of 114.40% in the previous thirty days.
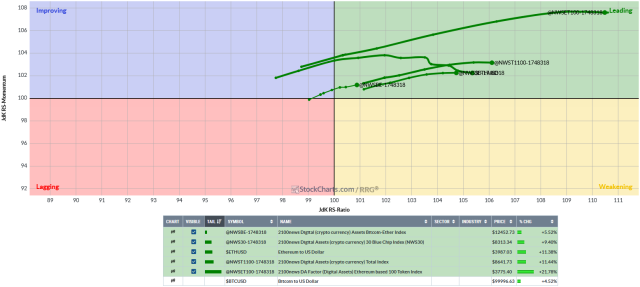
While the broader market has experienced a rally in such phase, that different segments, and individual cryptocurrencies exhibit same performance dynamics. Ether, NWSCo100, NWS30, NWSET100, NWSBE, and NWSL100 led, and Bitcoin lagged. The rotation indicates that a portion of the profits earned from Bitcoin is flowing into large-cap Coins; the impact is already being observed on tokens, which are typically the third in line to start rising but ultimately surpass the profits of those from the first two stages. Investors and traders might use this information to adjust their portfolios, possibly shifting focus toward assets with stronger relative momentum while being cautious about those in the Weakening quadrant.
*RRG® charts show the relative strength and momentum of groups of digital assets. Those with strong relative strength and momentum appear in the green Leading quadrant. As relative momentum fades, they typically move into the yellow Weakening quadrant. If relative strength then fades, they move into the red Lagging quadrant. Finally, when momentum picks up again, they shift into the blue Improving quadrant.
Crypto (Digital Assets) compared with global equity
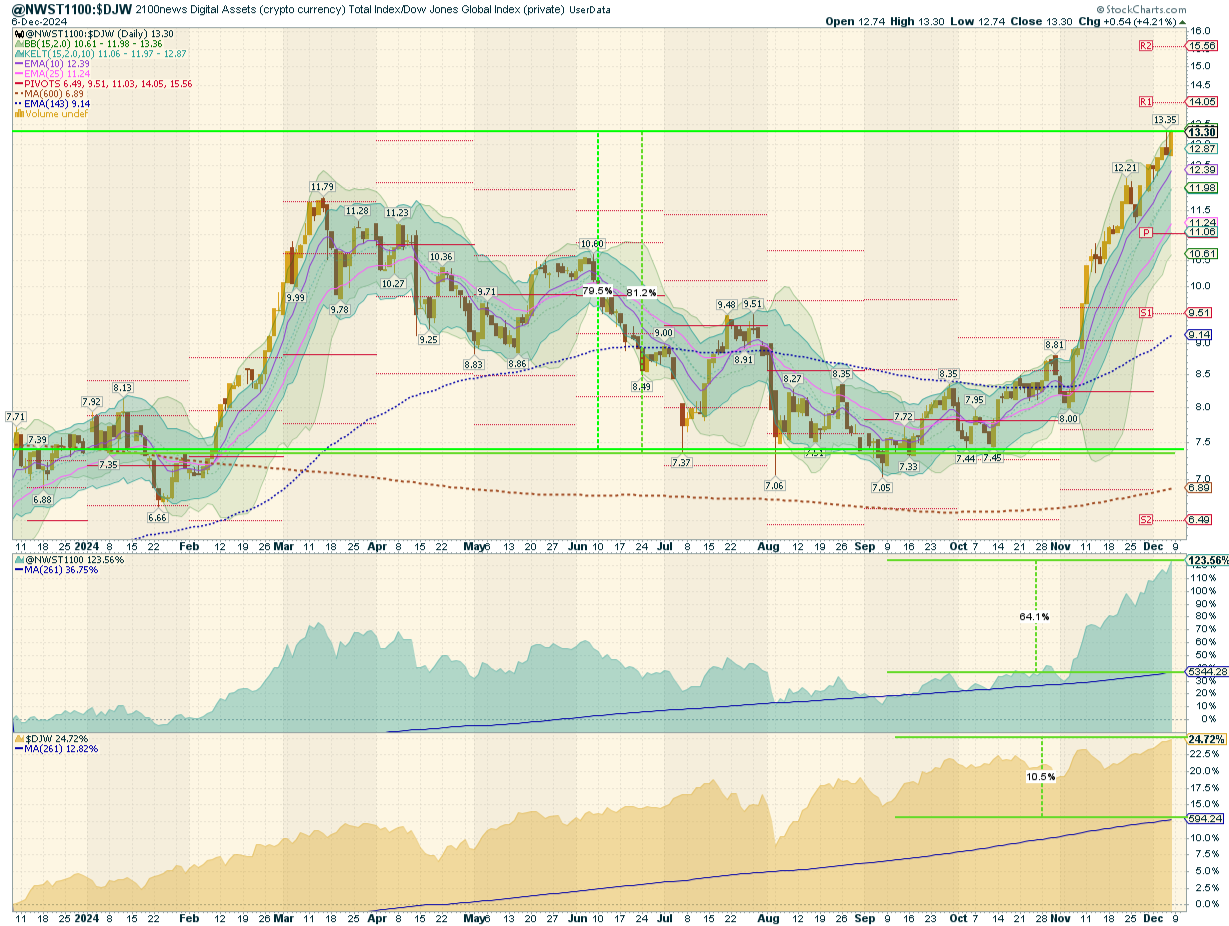
This report offers a comprehensive analysis comparing the performance of digital assets, as signified by the NWST1100 index, to shares on global capital markets, embodied by the Dow Jones Global W1Dow index. We draw insights into historical achievements and potential future trends by examining their performances over various timeframes.
Let’s break down the key observations and implications:
- Historical Performance Comparison:
- 37 Months Ago: Digital assets showcased a notable outperformance against shares in global capital markets, reaching a record high in the comparative quotient between the NWST1100 and W1Dow indexes. At this juncture, digital assets displayed a notably superior performance trajectory compared to shares on global capital markets.
- Twelve months ago, the advantage for digital assets became even more pronounced, surpassing shares by a margin of 79.5%. This difference highlights the substantial returns that digital assets have offered over traditional shares within this timeframe.
- Mean Reversion Opportunity:
- Over the past 143 working days, the average quotient price, represented by a blue dashed curve, stands at 9.14, while the current spot price is 13.30. This is higher than the long-term mean of 6.89, which has increased since October.
- The mean reversion theory suggests that asset prices, over time, tend to revert to their historical average returns. The current average quotient price above the long-run mean could imply that digital assets are currently highly valued compared to historical trends.
- Returns Comparison:
- The chart also presents the returns achieved with the stock generated by buying one point of the respective index daily over the past twelve months.
- The NWST1100 Crypto Index enjoyed a 123.56% appreciation relative to last year’s period. With daily index investments, an investor’s stock would have seen a 64.1% uplift compared to the index’s current price. Digital assets purchased over the preceding 12 months at an average price of 5,344 points were purchased at relatively elevated levels, as they were bought during a period when markets were yielding returns of several tens of percent compared to the previous year, and prices remained above the 143-day moving average for an extended period. The strong rally in November and December has made even these relatively expensive purchases profitable. However, for more substantial investment potential, acquisitions should ideally be made when the market is below the 143-day moving average, as it was this past summer and continued until two months ago.
- Contrasting with the crypto index, the DJW, representing global capital market shares, grew by 24.72% over the past twelve months. However, a strategy involving daily purchases would have resulted in a gain of 10.5%.
*The box in the middle of the chart shows the original NWST1100 price; at the bottom is W1Dow.
Indices Revision 12-6-2024
Based on the latest biweekly revision, Curve DAO, Virtual Protocol, EigenLayer, and Kaia have improved their ranking and were added to the NWSL100 index. On the other hand, Fasttoken, NEIRO, ZEEBU, and SATS were removed from the NWSL100 index. Several new mid-cap assets, including XYO, Bolnfida, Secret, etc., have been added to the NWSM200 index. More information about the additions and deletions for other indices in the family is available in each index’s presentation.
Winning member
Congratulations to Virtuals Protocol (VIRTUAL) for achieving a significant milestone by being recognized as the winning member of the NWSL100 crypto index with the most crucial leap in rank within the NWSL100 crypto index.
*We elect the member of the NWSL100 crypto index with the most significant jump in our ranking. We will examine how the market rates the project’s progress in case of price changes. It seems important to us whether the project is out of the ordinary tide of crypto project prices. Peer comparison should be efficient and effective, considering an investor’s point of view.
Virtuals Protocol (VIRTUAL) Website://www.virtuals.io/
VIRTUAL Large-cap Ethereum-based Token is 90th in the 2100NEWS ranking. It is an Index member: NWST1100, NWSL100, NWSTo100, and NEWSET100
2100NEWS DA Orderbook Quality Evaluation Grade: Poor, 13.3 (Average for Large-caps: 18.1)

Over the last week, the average market cap was $1,585.3 million, and the average daily volume was $163.8 million.
Virtuals Protocol (VIRTUAL) is an AI x Metaverse cryptocurrency protocol that aims to transform digital interactions by integrating artificial intelligence within immersive virtual environments. Serving as a foundational layer for co-owned, human-curated, plug-and-play gaming AIs, Virtuals Protocol leverages blockchain technology, virtual machines, and virtual networking to create secure, transparent, and scalable virtual worlds. Built on the IEEE Distributed Interactive Simulation Protocol, it enables developing and monetizing customizable AI personas within the Metaverse, offering new revenue streams for developers and contributors. Trading on major exchanges such as Bitget, BiKing, Hibt, BitMart, and BingX, Virtuals Protocol has gained traction within the crypto community. Its applications extend beyond trading, including extensive data analysis, generative AI, and interactive metaverse experiences. The protocol’s co-ownership model fosters community involvement, allowing users to co-own assets, incentivizing active participation, and ensuring equitable benefit distribution. Despite challenges like cost and security risks, Virtuals Protocol’s AI-driven focus and innovative approach position it as a key player in the future of virtual interactions, promising enhanced user experiences and a versatile platform for digital engagement.


 Litecoin