


2100NEWS WEEKLY CRYPTO REPORT Nov-1

The crypto index NWST1100 has increased by 1.15% over the last week; with a rise of 14.62%, Bitcoin has shown the most favorable performance within the previous 30 days.
*Below, we present a standardized weekly report and next week’s outlook, prepared based on the Theory Swingtum of intelligent finance. We gauge the crypto market’s breadth and direction by showing charts 2100NEWS Digital Assets Total Index (NWST1100), which measures 1100 (by market capitalization) significant crypto assets’ performance. The information-laden chart is complex to read initially, but the graph shows essential price information, crucial decisive price levels, momentum, trading volumes, and crypto market breadth. Monitoring Market Sentiment and Breadth is necessary to detect early signs of trend reversals or continued strength.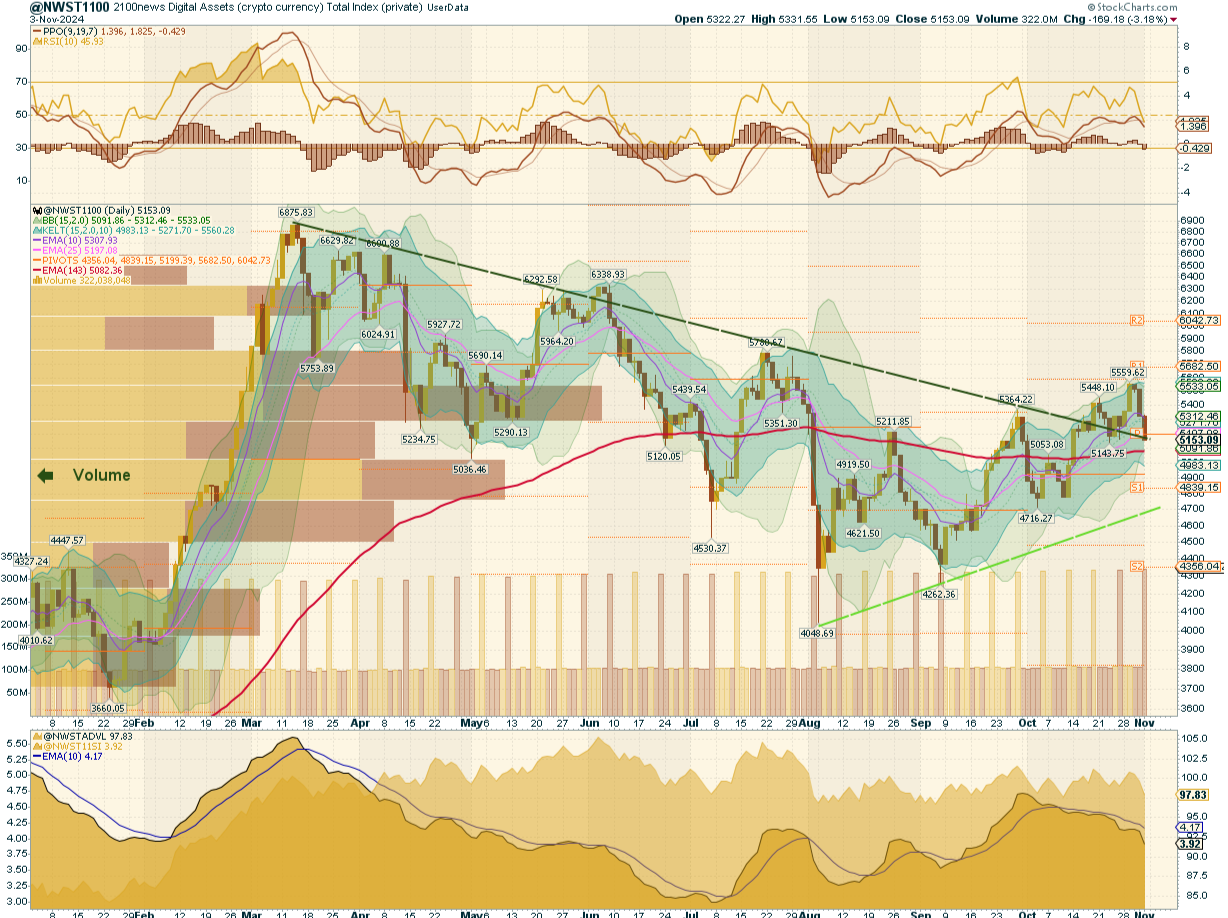
After conducting a detailed examination of the NWST1100 chart, a vital metric for the cryptocurrency market, reveals several important market dynamics and changes in market sentiment:
The NWST1100: On Tuesday, the index began with a sharp rally but faced resistance below a critical resistance level, R1. After failing to break past this level, the index experienced a steep decline over the following two days, ultimately testing the support level at Pivot P. This suggests that sellers gained control while there was initial bullish momentum as the rally lost steam near resistance.
Crypto Market Breadth indicators at the bottom of the chart show the Advance-Decline Line (ADVL) and McClellan Summation Index. The Advance-Decline Line (ADVL), which measures the number of advancing versus declining assets, showed a decline, indicating that more assets are losing ground than gaining. This downward movement suggests a narrowing market, with fewer assets contributing to any upward movement in the index. Similarly, a falling McClellan Summation Index, a long-term version of the McClellan Oscillator that measures market breadth, also showed signs of accelerated downward trend.

In summary, the NWST1100’s recent performance reveals a market struggling to maintain bullish momentum, with resistance at key levels leading to a reversal.
According to the chart on the right, all four A50R lines were falling and showed an oversold condition, with less than 30% of cryptocurrencies above their 50-day moving averages. This breadth indicator measures the percentage of digital assets trading above a 50-day moving average.
* The percentage of digital assets trading above a specific moving average is a breadth indicator that measures internal strength or weakness in the underlying index. The chart on the right side compares the percentage of DA trading above 50 days EMA for:
- 100 Large-caps members of NWSL100 (top box)
- 1100 members of NWST1100
- 100 Ethereum Tokens members of NWSET100
- 100 Coins members of NWSCo100 (bottom box)
Outlook for this week
This report analyzes the cryptocurrency market’s short-term outlook and aims to provide insights into its potential direction. Although predicting the market’s behavior is challenging, discernible patterns in market waves offer some predictability. By examining momentum indicators, we can identify several signals that shed light on the market’s possible direction in the short term.
- The PPO lines and histogram, which measure the market’s momentum, may change direction if the index rebounds from the 143-day EMA support. This suggests that the bullish momentum could revive, increasing the likelihood of an upward movement in the short term.
- The RSI (Relative Strength Index): Currently at 46, the RSI is in a neutral zone, indicating that the market has more room to grow before reaching overbought territory. This leaves room for potential upside, as the market could experience further gains without becoming overextended.
- The Breadth indicators, evident at the bottom of the first chart (NWST1100), may flatten, signaling a potential change in their trend. A rise in Breadth indicators, primarily the McClellan Summation Index (chart below), signals broad market participation.
In conclusion, the market’s short-term outlook appears optimistic, with momentum indicators suggesting a possible reversal in the current corrective trend. If the NWST1100 index rebounds, it is likely to target levels above Pivot R1, indicating the potential for further gains. Improved market breadth and supportive external factors like positive sentiment surrounding the U.S. elections could contribute to continued upward movement in the cryptocurrency market.

Performance of different groups of Digital Assets (Coins and Tokens)

Investors and traders often rely on historical performance data to make informed decisions about their cryptocurrency holdings. After analyzing the data in the table, it can be seen that the overall index has increased by 1.15% over the last week.  The chart above highlights the performance of various cryptocurrencies, such as Bitcoin, Ether, and the 2100NEWS Indices, which represent the performance of Ethereum-based tokens (NWSET100), Large caps (NWSL100), and Coins (NWSCo100). Bitcoin has outperformed other segments, with a gain of 14.62% over the last thirty days.

While the broader market is experiencing a retracement, different segments, as well as individual cryptocurrencies, exhibit varied performance dynamics. Bitcoin and indices NWSBE and NWS30 were leading; Ether and indices NWSET100, NWSCo100, and NWSL100 were lagging. Investors and traders might use this information to adjust their portfolios, possibly shifting focus toward assets with stronger relative momentum while being cautious about those in the Weakening quadrant.
*RRG® charts show the relative strength and momentum of groups of digital assets. Those with strong relative strength and momentum appear in the green Leading quadrant. As relative momentum fades, they typically move into the yellow Weakening quadrant. If relative strength then fades, they move into the red Lagging quadrant. Finally, when momentum picks up again, they shift into the blue Improving quadrant.
Crypto (Digital Assets) compared with global equity
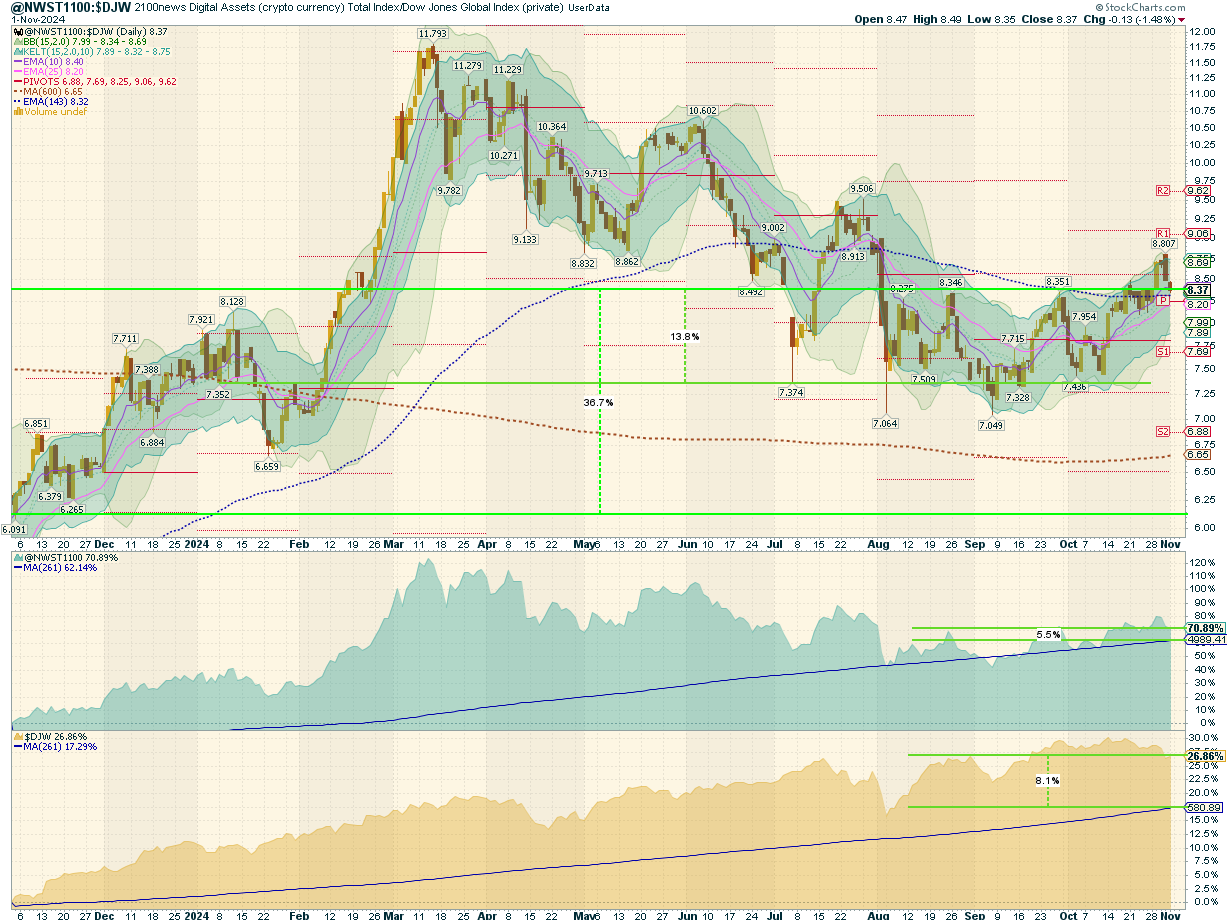
This report offers a comprehensive analysis comparing the performance of digital assets, as signified by the NWST1100 index, to shares on global capital markets, as represented by the Dow Jones Global W1Dow index. The comparison spans various timeframes, offering insights into historical and recent performances and potential future trends.
Let’s break down the key observations and implications:
- Historical Performance Comparison:
- 36 Months Ago: Digital assets showcased a notable outperformance against shares in global capital markets, reaching a record high in the comparative quotient between the NWST1100 and W1Dow indexes. At this juncture, digital assets displayed a notably superior performance trajectory compared to shares on global capital markets.
- Twelve months ago, the advantage for digital assets became even more pronounced, with digital assets outperforming shares by a margin of 36.7%. This difference highlights the substantial returns that digital assets have offered over traditional equity within this timeframe.
- Mean Reversion Opportunity:
- Over the past 143 working days, the average quotient price, represented by a blue dashed curve, stands at 8.32, while the current spot price is 8.37. This is higher than the long-term mean of 6.65, which has increased since October.
- The mean reversion theory suggests that asset prices, over time, tend to revert to their historical average returns. The current average quotient price above the long-run mean could imply that digital assets are currently highly valued compared to historical trends.
- Returns Comparison:
- The chart also presents the returns achieved with the stock generated by buying one point of the respective index daily over the past twelve months. The NWST1100 Crypto Index enjoyed a 70.89% appreciation relative to last year’s period. With daily index investments, an investor’s stock would have seen only a 5.5% uplift compared to the index’s current price. Digital assets purchased over the preceding 12 months at an average price of 4,989 points were purchased at relatively elevated levels, as they were bought during a period when markets were yielding returns of several tens of percent compared to the previous year, and prices remained above the 143-day moving average for an extended period. This highlights the importance of timing in making purchases, suggesting that, for more substantial investment potential moving forward, acquisitions should be made when the market is below the 143-day moving average, as it was this past summer and has continued until three weeks ago.
- Contrasting with the crypto index, the DJW, representing global capital market shares, grew by 26.86% over the past year. However, a strategy involving daily purchases would have resulted in a gain of 8.1%.
*The box in the middle of the chart shows the original NWST1100 price; at the bottom is W1Dow.


 Litecoin