


2100NEWS WEEKLY CRYPTO REPORT Sep-13

The NWST1100 index soared 12.63% from the previous week. Helium (HNT), a large-cap Coin, has biweekly made the most significant leap in rank within the NWSL100 crypto index.
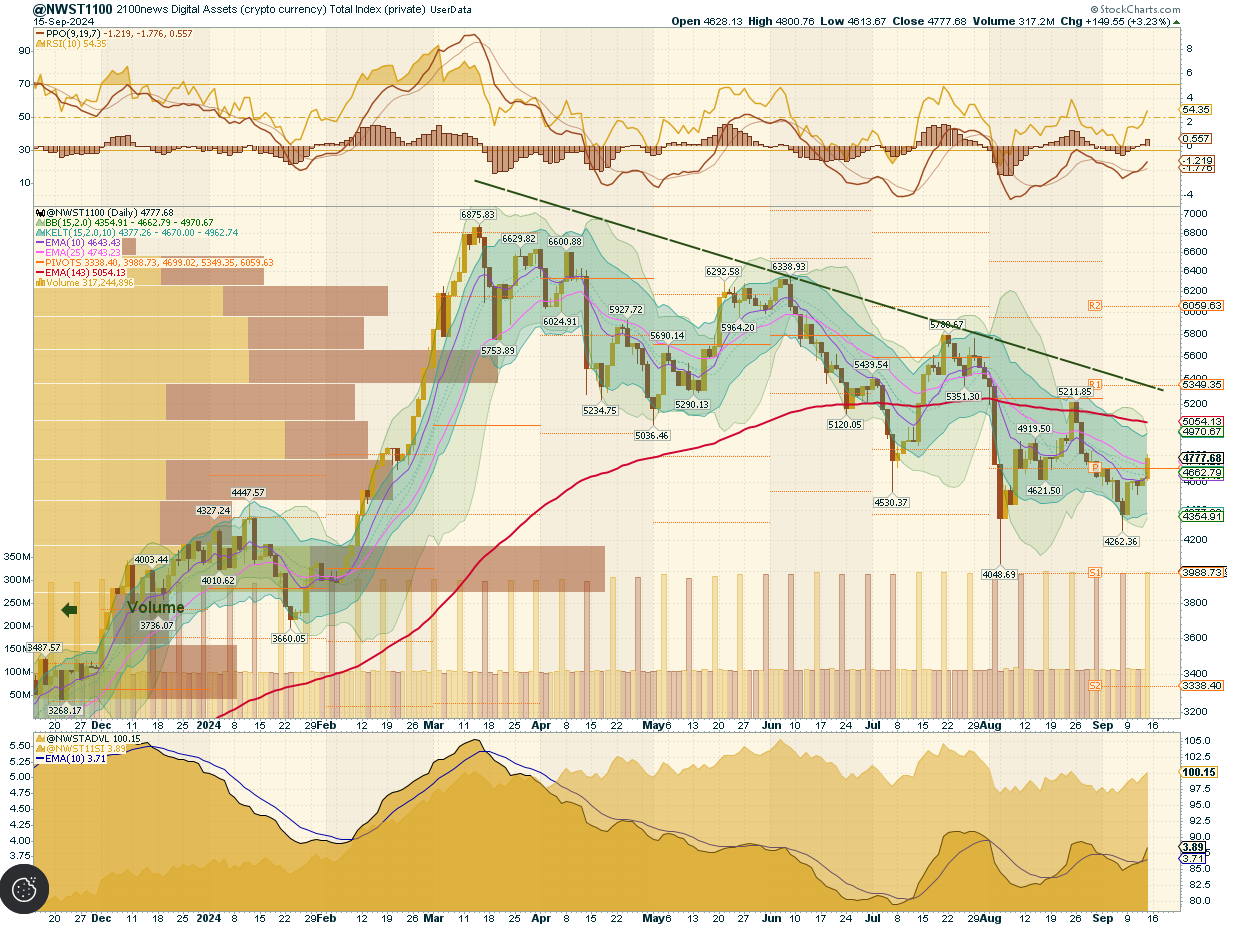
*Below, we present a standardized weekly report and next week’s outlook, prepared based on the Theory Swingtum of intelligent finance. We gauge the crypto market’s breadth and direction by showing charts 2100NEWS Digital Assets Total Index (NWST1100), which measures 1100 (by market capitalization) significant crypto assets’ performance. The information-laden chart is complex to read initially, but the chart shows essential price information, crucial decisive price levels, momentum, trading volumes, and crypto market breadth. Monitoring Market Sentiment and Breadth is necessary to detect early signs of trend reversals or continued strength.
 Our detailed analysis of the NWST1100 chart and related market indicators reveals essential insights into the current market conditions:
- The analysis of the NWST1100 chart shows that the index has experienced recovery and has approached a resistance level, identified as 25-Days EMA.
- Market sentiment: The Price Oscillator (PPO) lines and histogram continued an upward trend, and the RSI (Relative Strength Index) maintained an upward trend.
- We are now focusing on the breadth indicators at the bottom of the NWST1100 chart. The Advance-Decline Line (ADVL) and McClellan Summation Index have risen, suggesting a broader market recovery.
These indicators suggest that the overall market sentiment remains positive, with broad participation in the recovery. However, monitoring these indicators will be crucial for anticipating future movements and potential consolidation phases as the market approaches resistance levels.

According to the chart on the right, three A50R lines were settled in the neutral territory. This condition suggests that many cryptocurrencies are trading near their 50-day moving averages. This breadth indicator measures the percentage of digital assets trading above a 50-day moving average.
*This breadth indicator is essential in measuring the internal strength or weakness of the underlying index. Looking at the chart on the right side, we can see the A50R lines for four different categories of digital assets:
- The top box shows the A50R lines for 100 Large-cap members of NWSL100.
- The middle box displays the A50R lines for 1100 members of NWST1100, which is the Total Index measuring the performance of significant crypto assets based on market capitalization.
- The third box shows the A50R lines for 100 Ethereum Tokens members of NWSET100.
- The bottom box represents the A50R lines for 100 Coins members of NWSCo100., tako
Outlook for this week
This report aims to provide insights into the cryptocurrency market’s near-term outlook. While complete predictability remains challenging, the market waves show some degree of predictability with discernible patterns in market behavior. By examining momentum indicators, several signals emerge that offer insights into the potential direction of the market in the short term.
- The RSI (Relative Strength Index), with an RSI reading of 54, is rising in the neutral zone, suggesting that the market may soon be overbought. This indicates a potential for price corrections or consolidation.
- The PPO histogram may stop rising, suggesting that the upward momentum is losing steam, which might lead to a retrace in the market.
- The Breadth indicators at the bottom of the first chart (NWST1100) may continue rising; if indicators such as the Advance-Decline Line (ADVL) or the McClellan Summation Index rise, this might suggest broadening market support.
With these indicators in mind, as the market has rebounded from strong support levels, the combination of momentum and breadth indicators suggests that a market consolidation could be likely as the market processes recent gains and prepares for future movements. For the coming week, the target range for the market will likely be around Pivot P.

Investors and traders often rely on historical performance data to make informed decisions about their cryptocurrency holdings. After analyzing the data in the table, it can be seen that the overall index has soared 12.63% over the last week.  The chart above highlights the performance of various cryptocurrencies, such as Bitcoin, Ether, and the 2100NEWS Indices, which represent the performance of Ethereum-based tokens (NWSET100), Large caps (NWSL100), and Coins (NWSCo100). Ethereum-based tokens represented by the NWSET100 index have outperformed other segments, with a gain of 2.10% over the last thirty days.

While the broader market has experienced a recovery, different segments and individual cryptocurrencies exhibit varied performance dynamics. NWSCo100, NWSET100, and NWSL100 were leading, while Ether was improving; Bitcoin was weakening, and indices NWS30 and the NWSBE were lagging. Investors and traders might use this information to adjust their portfolios, possibly shifting focus toward assets with stronger relative momentum while being cautious about those in the Weakening quadrant.
*RRG® charts show the relative strength and momentum of groups of digital assets. Those with strong relative strength and momentum appear in the green Leading quadrant. As relative momentum fades, they typically move into the yellow Weakening quadrant. If relative strength then fades, they move into the red Lagging quadrant. Finally, when momentum picks up again, they shift into the blue Improving quadrant.
Crypto (Digital Assets) compared with global equity
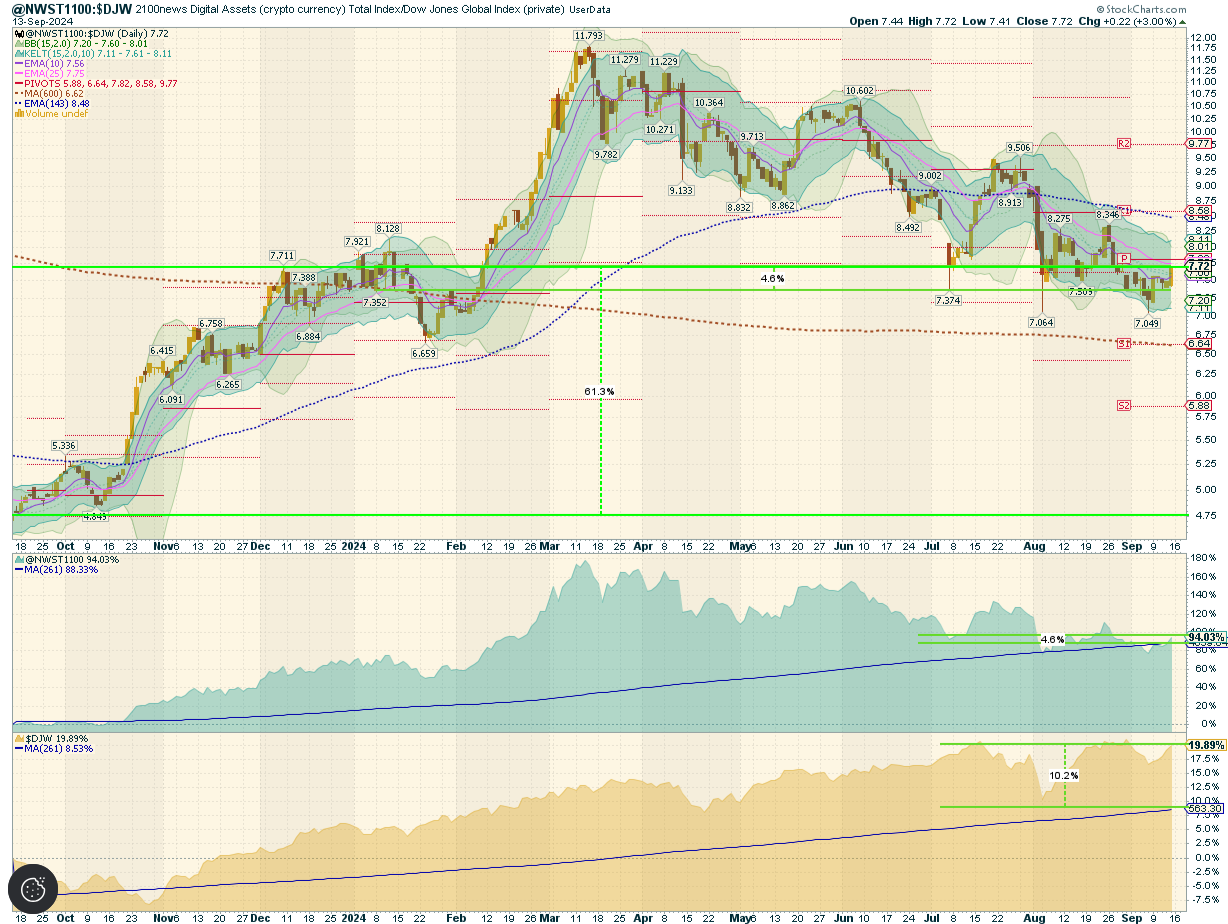
This report offers a comprehensive analysis comparing the performance of digital assets, as signified by the NWST1100 index, to shares on global capital markets, embodied by the Dow Jones Global W1Dow index. We draw insights into historical achievements and potential future trends by examining their performances over various timeframes.
Let’s break down the key observations and implications:
- Historical Performance Comparison:
- 34 Months Ago: Digital assets showcased a notable outperformance against shares in global capital markets, reaching a record high in the comparative quotient between the NWST1100 and W1Dow indexes. At this juncture, digital assets displayed a notably superior performance trajectory compared to shares on global capital markets.
- Twelve months ago, the advantage for digital assets became even more pronounced, with digital assets outperforming shares by a margin of 61.3%. This stark difference highlights the substantial returns that digital assets have offered over traditional shares within this timeframe.
- Mean Reversion Opportunity:
- Over the past 143 working days, the average quotient price, represented by a blue dashed curve, stands at 8.48, while the current spot price is 7.72. This is higher than the long-term mean of 6.62.
- The mean reversion theory suggests that asset prices, over time, tend to revert to their historical average returns. The current average quotient price above the long-run mean could imply that digital assets are currently highly valued compared to historical trends.
- Returns Comparison:
- The chart also presents the returns achieved with the stock generated by buying one point of the respective index daily over the past twelve months.
- The NWST1100 Crypto Index enjoyed a 94.03% appreciation relative to last year’s period. With daily index investments, an investor’s stock would have seen only a 4.6% uplift compared to the index’s current price. Digital assets purchased over the preceding 12 months at an average price of 4,693 points were purchased at relatively elevated levels, as they were bought during a period when markets were yielding returns of several tens of percent compared to the previous year, and prices remained above the 143-day moving average for an extended period. This highlights the importance of timing in making purchases, suggesting that, for stronger investment potential moving forward, acquisitions should be made when the market is below the 143-day moving average, as it was this past summer and continues to be at present.
- Contrasting with the crypto index, the DJW, representing global capital market shares, grew by 19.89% over the past year. However, a strategy involving daily purchases would have resulted in a gain of 10.2%.
*The box in the middle of the chart shows the original NWST1100 price; at the bottom is W1Dow.
Indices Revision 9-13-2024
Based on the latest biweekly revision, several new mid-cap assets, including SUNDOG, Drift Protocol, Radiant Capital, etc., have been added to the NWSM200 index. More information about the additions and deletions for other indices in the family is available in each index’s presentation.
Winning member
Congratulations to Helium (HNT) for achieving a significant milestone by being recognized as the winning member of the NWSL100 crypto index with the most crucial leap in rank within the NWSL100 crypto index.
*We elect the member of the NWSL100 crypto index with the most significant jump in our ranking. We will examine how the market rates the project’s progress in case of price changes. It seems important to us whether the project is out of the ordinary tide of crypto project prices. Peer comparison should be efficient and effective, considering an investor’s point of view.
Helium (HNT) Website: https://helium.com/
HNT Large-cap Coin is 77th in the 2100NEWS ranking. It is an Index member: NWST1100, NWSL100, and NWSCo100
2100NEWS DA Orderbook Quality Evaluation Grade: Poor, 11.1 (Average for Large-caps: 18.0)
Over the last week, the average market cap was $1,269.2 million, and the average daily volume was $17.4 million.
Launched in July 2019, Helium is a decentralized wireless network that allows low-power smart devices to send and receive data to the internet. Miners earn HNT for providing network coverage and relaying data to the internet using Hotspot hardware.


 Litecoin