


2100NEWS WEEKLY CRYPTO REPORT Jan-19

The index for NWST1100 has fallen 1.67% over the last week; Ether has shown the most favorable performance within the previous 30 days, with a gain of over 6.3%.
*Below, we present a standardized weekly report and next week’s outlook, prepared based on the Theory Swingtum of intelligent finance. We gauge the crypto market’s breadth and direction by showing charts 2100NEWS Digital Assets Total Index (NWST1100), which measures 1100 (by market capitalization) significant crypto assets’ performance. The information-laden chart is complex to read initially, but the graph shows essential price information, crucial decisive price levels, momentum, trading volumes, and crypto market breadth.
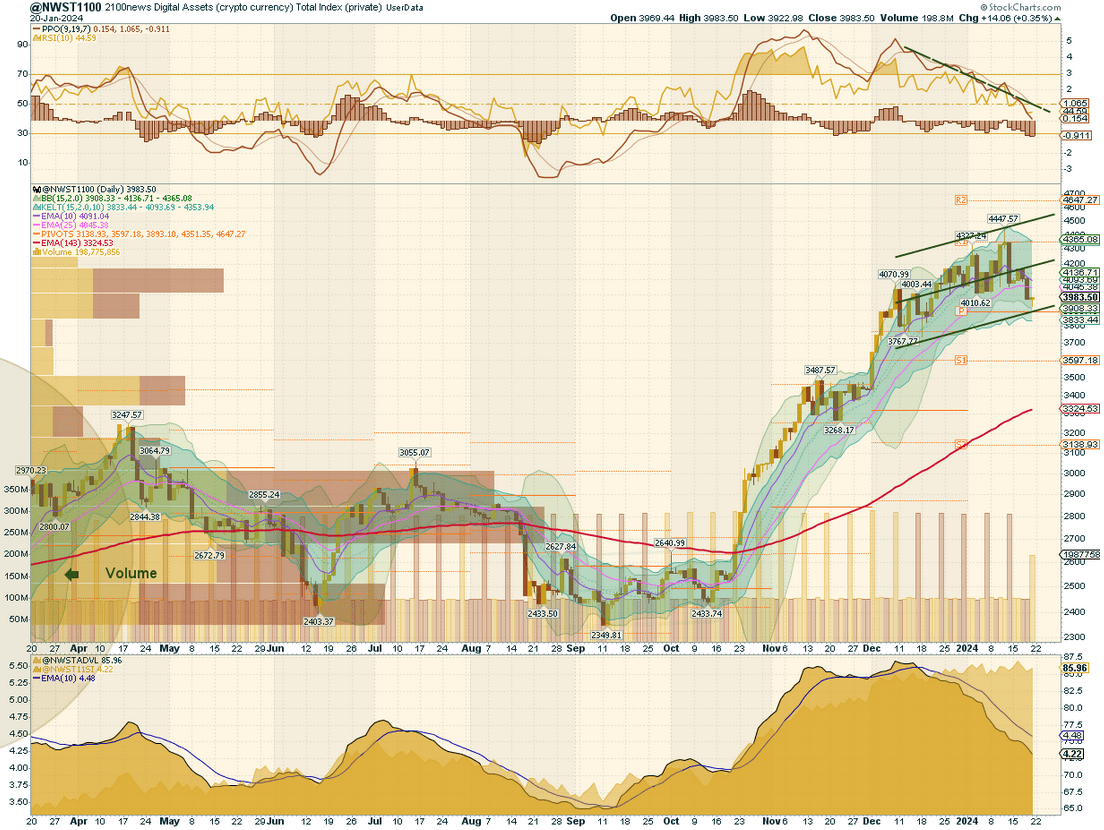
Based on our previous analysis, where we predicted that the market would likely stay above 25-day EMA, we have conducted a detailed examination of the NWST1100 index chart, which serves as a significant benchmark index and reveals a multitude of noteworthy insights:
- The NWST1100: The index has encountered a significant pullback, interrupting its ascent and hovering around a crucial technical juncture. This retracement suggests a pause in the bullish momentum witnessed in the previous months.
- Market Sentiment: The PPO lines and a PPO histogram have continued their descent, suggesting a possible bearish momentum. The RSI has trended downwards. This shift indicates a potential reversal of the previously optimistic market sentiment.
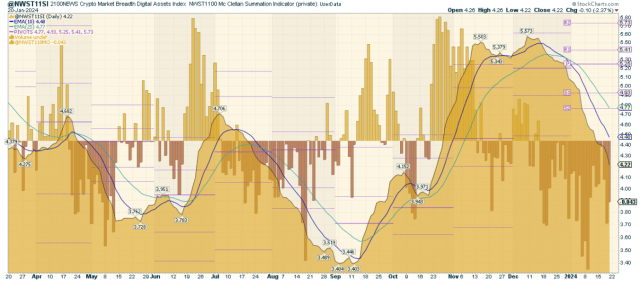
- Crypto Market Breadth indicators at the bottom of the chart provide a more cautious perspective. A falling Advance-Decline Line (ADVL) suggests that fewer individual cryptocurrencies are participating in the rally, which could be a sign of weakening market breadth. Similarly, a falling McClellan Summation Index, a long-term version of the McClellan Oscillator that measures market breadth, could indicate the downward momentum.
Based on these indicators, the market seems to be exhibiting signs of cautiousness because of reduced buying momentum. Considering the upcoming Bitcoin halving, a likely scenario involves a corrective dip of up to 20% from the recent highs, which investors may view as a buying opportunity, potentially leading to a resurgence of the bullish trend. This correction could also eliminate speculative excesses from the market, particularly those who, in their greed, expected a continuous uptrend following last year’s rally and the ETF-related excitement but are now eager to offload their assets purchased at higher prices.
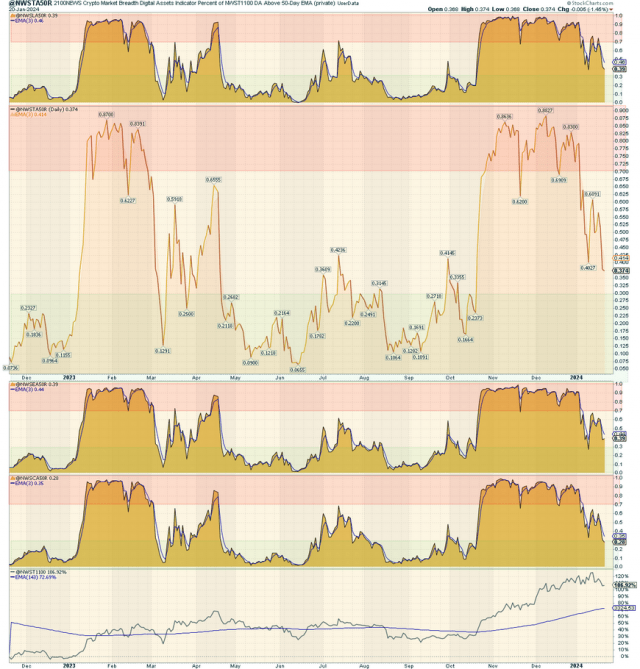
According to the chart on the right, all four A50R lines have settled in the neutral zone. This breadth indicator measures the percentage of digital assets trading above a 50-day moving average. The current condition suggests that about half of the cryptocurrency market trades above its 50-day EMA.
* The percentage of digital assets trading above a specific moving average is a breadth indicator that measures internal strength or weakness in the underlying index. The chart on the right side compares the percentage of DA trading above 50 days EMA for:
- 100 Large-caps members of NWSL100 (top box)
- 1100 members of NWST1100
- 100 Ethereum Tokens members of NWSET100
- 100 Coins members of NWSCo100 (bottom box)
Outlook for this week
This report analyzes the cryptocurrency market’s short-term outlook and aims to provide insights into its potential direction. Although predicting the market’s behavior is challenging, discernible patterns in market waves offer some predictability. By examining momentum indicators, we can identify several signals that shed light on the market’s possible direction in the short term.
- The PPO lines may change the slope to an ascending, and the histogram may start rising, suggesting a turnaround to bullish momentum.
- Looking at the breadth indicators at the bottom of the NWST1100 chart. The McClellan Summation Index (as shown in the chart below) – a derivative of the McClellan Oscillator – may cease its decline. The oscillator has been negative since the beginning of December, and the Summation index is nearing levels that historically precede reversals, hinting at an imminent change in trend.
- The resemblance of the current A50R lines to those seen in March of the previous year, which led to a market rebound, adds to the anticipation of a recovery.
With the Bitcoin halving event on the horizon in April, the likelihood of a sustained bearish trend diminishes, reinforcing expectations of a near-term rebound. Despite the potential for a 20% correction, the market’s momentum and breadth indicators point towards a swift recovery by the end of the week. In summary, The NWST1100 index is anticipated to test the S1 support level or possibly the 143-day EMA. The prevailing conditions, however, favor a quick and pronounced recovery, resisting a deeper descent into bearish territory.
Performance of different groups of Digital Assets (Coins and Tokens)
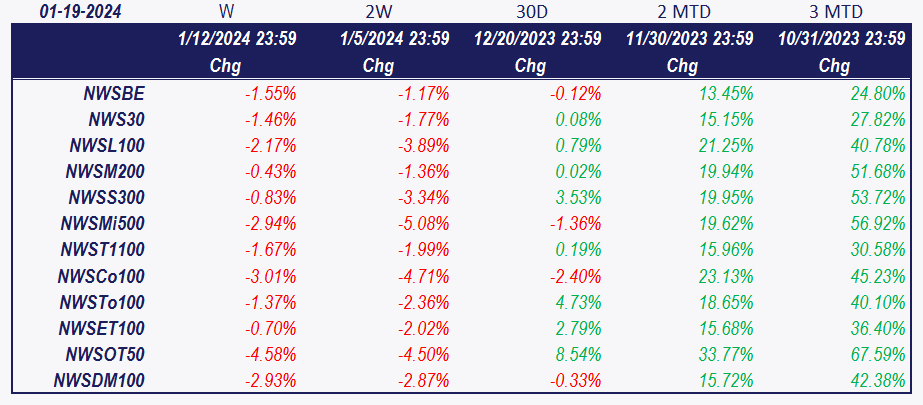
Investors and traders often rely on historical performance data to make informed decisions about their cryptocurrency holdings. After analyzing the data in the table, the overall index NWST1100 has fallen by 1.67% over the last week, indicating a pullback in the broader cryptocurrency market. 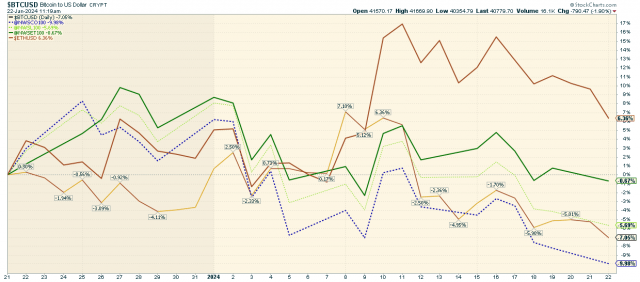 The chart below highlights the performance of various cryptocurrencies, such as Bitcoin, Ether, and the 2100NEWS Indices, which represent the performance of Ethereum-based tokens (NWSET100), Large caps (NWSL100), and Coins (NWSCo100). A retrospective view over the last thirty days indicates that Ether has shown the most promising performance, with a gain of over 6.3%.
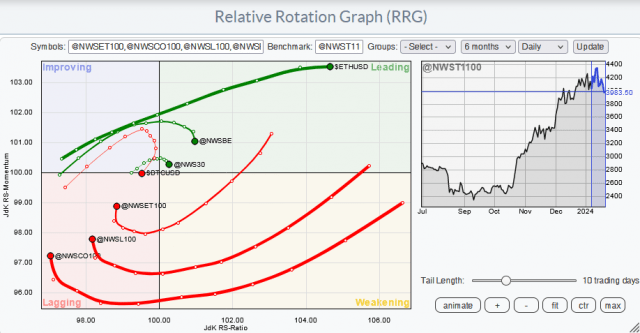
While the broader market is experiencing a pullback, different segments and individual cryptocurrencies exhibit varied performance dynamics. Ether and certain indices like NWSBE and NWWS30 are leading. In contrast, NWSET100, NWSCo100, Bitcoin, and NWSL100 are lagging . Investors and traders might use this information to adjust their portfolios, possibly shifting focus toward assets with stronger relative momentum while being cautious about those in the Weakening quadrant.
*RRG® charts show you the relative strength and momentum of groups of digital assets. That with strong relative strength and momentum appears in the green Leading quadrant. As relative momentum fades, they typically move into the yellow Weakening quadrant. If relative strength then fades, they move into the red Lagging quadrant. Finally, when momentum picks up again, they shift into the blue Improving quadrant.
Crypto (Digital Assets) compared with global equity
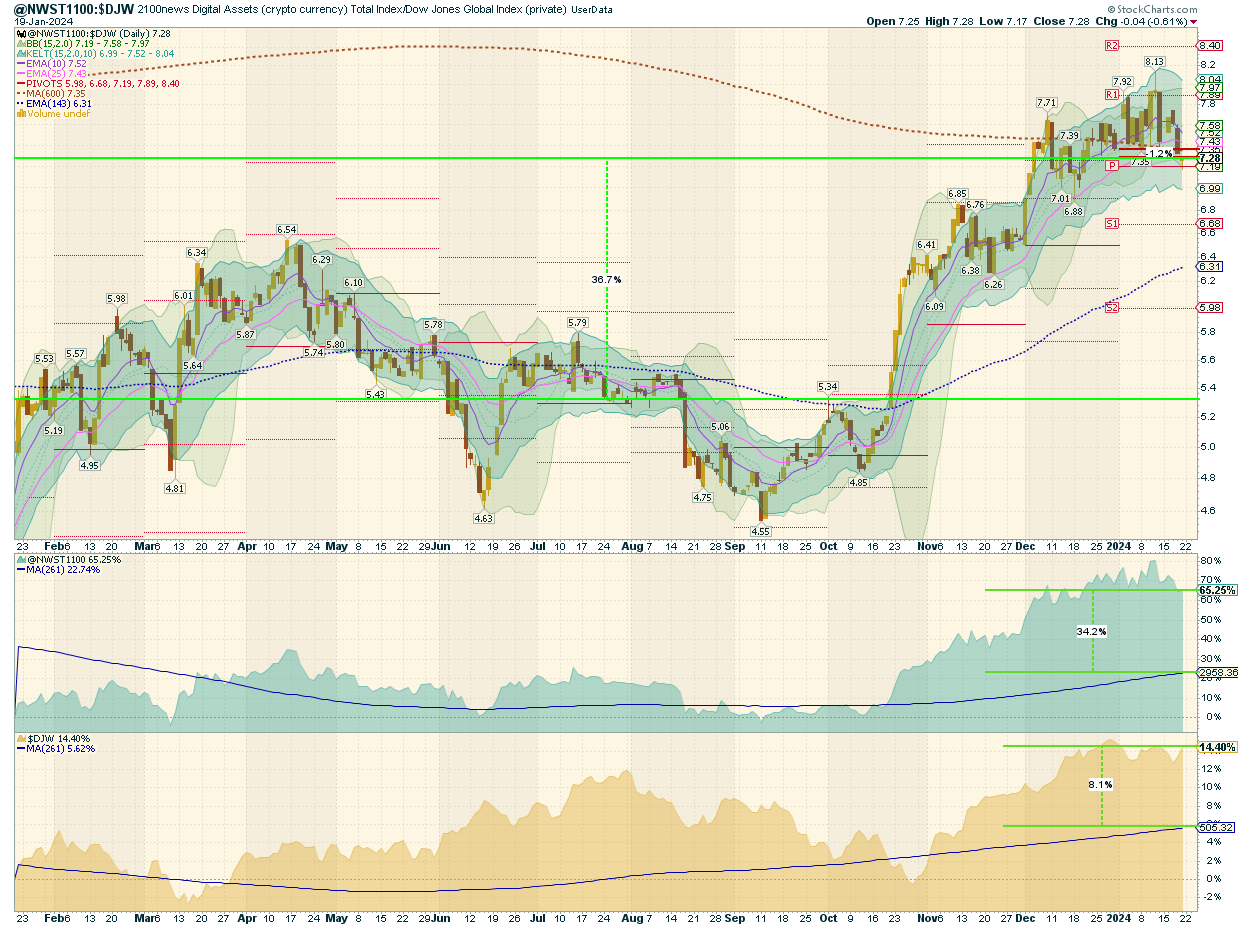
This report offers a comprehensive analysis comparing the performance of digital assets, as signified by the NWST1100 index, to shares on global capital markets, as represented by the Dow Jones Global W1Dow index. The comparison spans various timeframes, offering insights into historical and recent performances and potential future trends.
Let’s break down the key observations and implications:
- Historical Performance Comparison:
- 26 Months Ago: Digital assets, represented by the NWST1100 index, were outperforming shares on capital markets, represented by the W1Dow index, with a record high quotient between the two indexes. At this juncture, digital assets displayed a notably superior performance trajectory compared to shares on global capital markets.
- 12 Months Ago: Fast-forwarding to a year back, digital assets had a clear edge, outperforming shares by 36.7%. This performance data accentuates the heightened returns digital assets offered over shares in the specified duration.
- Mean Reversion Opportunity:
- The average quotient price over the past 143 working days is plotted as a blue dashed curve (6.31). Currently, this average sits near its long-run mean, hovering around 7.35. However, the spot price is 7.28.
- The mean reversion theory suggests that asset prices, over time, tend to revert to their historical average returns. The current average quotient price at the long-run mean could imply that digital assets are currently fairly valued compared to historical trends.
- Returns Comparison:
- The chart also presents the returns achieved with the stock generated by buying one point of the respective index daily over the past twelve months.
- The NWST1100 Crypto Index enjoyed a 65.25% appreciation relative to last year’s period. With daily index investments, an investor’s stock would have seen a 34.2% uplift compared to the index’s current price.
- Contrasting with the crypto index, the DJW, representing global capital market shares, grew by 14.40% over the past year. However, a strategy involving daily purchases would have resulted in a gain of 8.1%.
- Expectations are rife as we stand the confirmed bullish trend between digital assets and global capital market shares. Digital assets purchased over the preceding year at an average price of 2958 points seem poised to offer magnified returns compared to shares as we traverse this bullish phase.
*The box in the middle of the chart shows the original NWST1100 price; at the bottom is W1Dow.


 Litecoin