


2100NEWS WEEKLY CRYPTO REPORT Jan-12

The NWST1100 index has decreased by 0.35% from the previous week. Bonk(BONK), a Large-cap Non-Ethereum-Token, is biweekly making the most significant leap in rank within the NWSL100 crypto index.
*Below, we present a standardized weekly report and next week’s outlook, prepared based on the Theory Swingtum of intelligent finance. We gauge the crypto market’s breadth and direction by showing charts 2100NEWS Digital Assets Total Index (NWST1100), which measures 1100 (by market capitalization) significant crypto assets’ performance. The information-laden chart is complex to read initially, but the chart shows essential price information, crucial decisive price levels, momentum, trading volumes, and crypto market breadth.
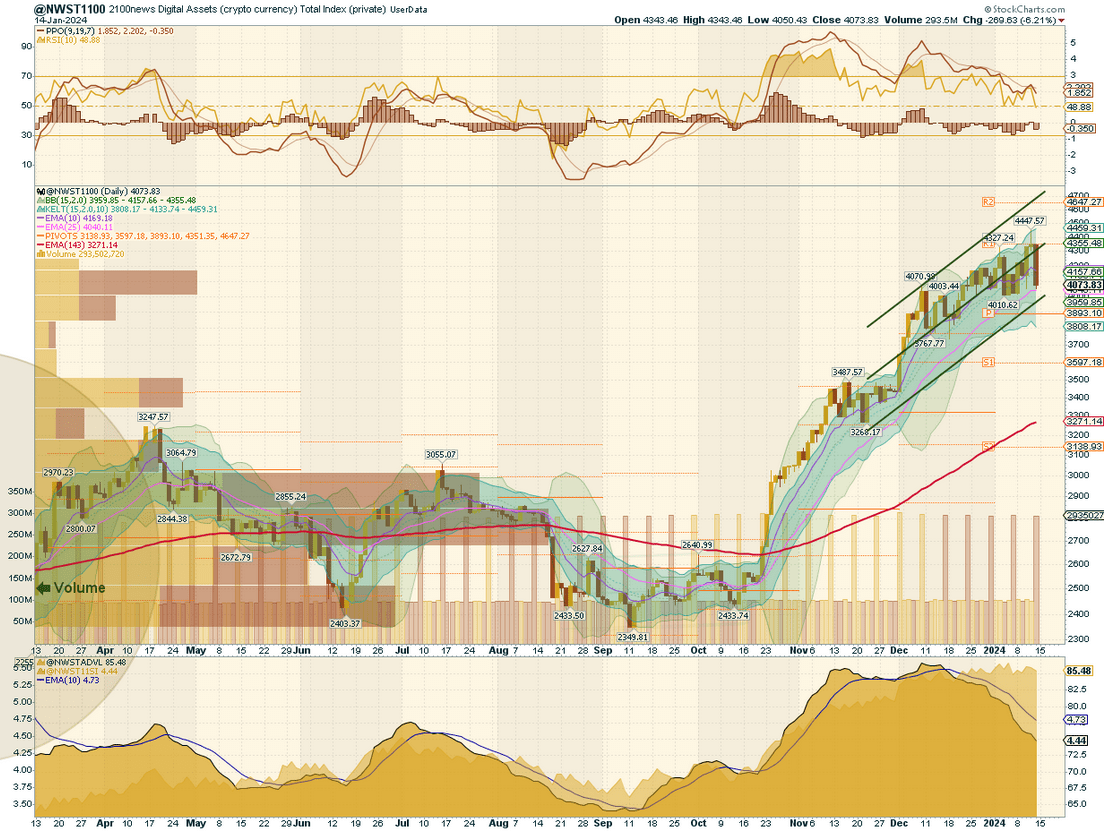
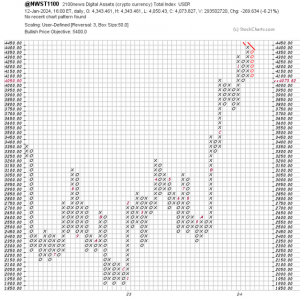 Based on our previous analysis, where we predicted the NWST1100 index would likely renew its rally and potentially surpass the resistance level R1, we have conducted a detailed examination of the NWST1100 chart, a vital metric for the cryptocurrency market. Our thorough review of various indicators has yielded a plethora of salient observations:
- The analysis of the NWST1100 chart suggests that the market is currently in a pullback phase after surpassing the resistance level R1.
- Market sentiment: The slight fall in the PPO and its descending histogram slope indicate a mild pullback in the market. This suggests a decrease in the momentum of price changes, which could be a sign of market hesitation or a temporary slowdown in trend. The RSI has trended downwards.
- We are shifting our focus to the Crypto Market Breadth indicators at the bottom of the NWST1100 chart. A falling Advance-Decline Line (ADVL) suggests that fewer individual cryptocurrencies are participating in the rally, which could be a sign of weakening market breadth. Similarly, a falling McClellan Summation Index, a long-term version of the McClellan Oscillator that measures market breadth, could indicate that the upward momentum is not as strong as it could be.
Based on these indicators, the market seems to be exhibiting signs of cautiousness because of reduced buying momentum. The recent surge in the crypto market, primarily influenced by the SEC’s approval of the Spot Bitcoin ETF and the potential for Ethereum ETFs, seems to have reached a point of market saturation. The anticipation of these events may have generated more excitement and trading activity than the events themselves, leading to the current pullback. The market digests recent gains, and investors evaluate the next potential moves.
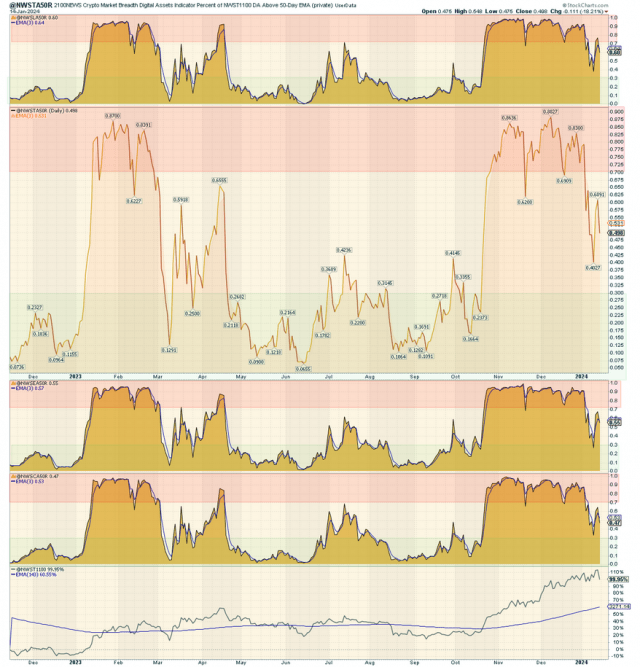
According to the chart on the right, all four A50R lines have settled in the neutral zone. This breadth indicator measures the percentage of digital assets trading above a 50-day moving average. The current condition suggests that about half of the cryptocurrency market trades above its 50-day EMA, indicating a balanced market without a clear bullish or bearish dominance.
*This breadth indicator is essential in measuring the internal strength or weakness of the underlying index. Looking at the chart on the right side, we can see the A50R lines for four different categories of digital assets:
- The top box shows the A50R lines for 100 Large-cap members of NWSL100.
- The middle box displays the A50R lines for 1100 members of NWST1100, which is the Total Index measuring the performance of significant crypto assets based on market capitalization.
- The third box shows the A50R lines for 100 Ethereum Tokens members of NWSET100.
- The bottom box represents the A50R lines for 100 Coins members of NWSCo100.
Outlook for this week
This report aims to provide insights into the cryptocurrency market’s near-term outlook. While complete predictability remains challenging, the market waves show some degree of predictability with discernible patterns in market behavior. By examining momentum indicators, several signals emerge that offer insights into the potential direction of the market in the short term.
- The market shows bullish trends that differ from those seen in the early months of the last year, as highlighted by the patterns within the ellipses on the chart. This shift suggests a change in market dynamics and investor sentiment, potentially leading to more sustained upward movements.
- The RSI (Relative Strength Index) with an RSI reading of 49 indicates the market is balanced.
- The PPO lines and histogram may change the slope to an ascending, suggesting a turnaround in momentum.
- The Breadth indicators at the bottom of the first chart (NWST1100) may cease their decline. The potential rise in Breadth indicators, notably the McClellan Summation Index, hints at widening participation, which is often bullish.
Considering these momentum indicators, we anticipate that the crypto market may continue to hold its ground, trending sideways, indicating that it will maintain its recent gains and not succumb to downward pressure. NWST1100 index will likely stay above 25-day EMA.
Performance of various groups of Digital Assets (Coins and Tokens)
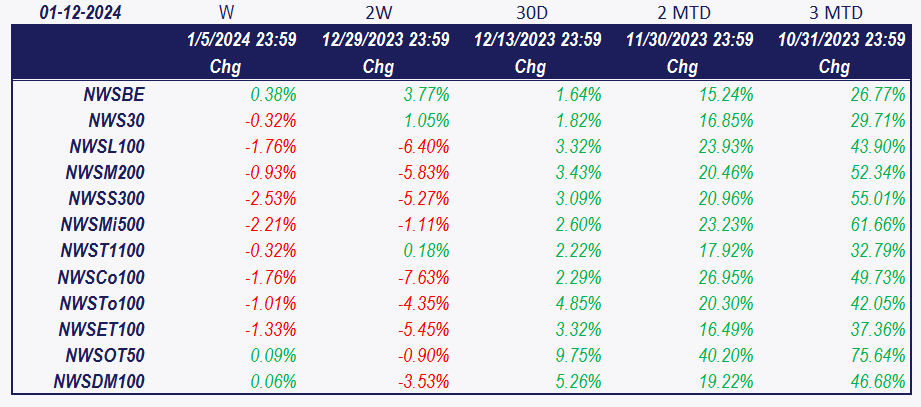
Investors and traders often rely on historical performance data to make informed decisions about their cryptocurrency holdings. After analyzing the data in the table, it can be seen that the overall index has slightly decreased by 0.32% over the last week.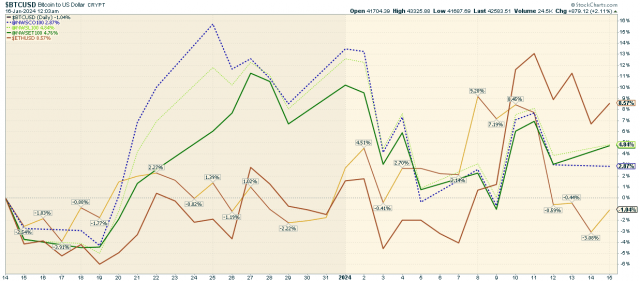
The chart above shows the performance of various cryptocurrencies, including Bitcoin, Ether, and the 2100NEWS Indices. These indices represent the performance of Ethereum-based tokens, Large caps, and Coins (NWSCo100). A retrospective view over the last thirty days indicates that Ether has shown the most promising performance, with a gain of over 8.5%.
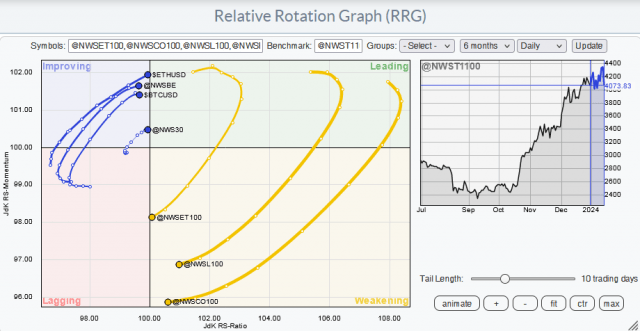
While the broader market was experiencing a consolidation, different segments, and individual cryptocurrencies exhibited varied performance dynamics. Bitcoin, Ether, and certain indices like NWSBE and NWWS30 are improving. In contrast, NWSCo100, NWSET100, and NWSL100 are weakening. Investors and traders might use this information to adjust their portfolios, possibly shifting focus toward assets with stronger relative momentum while being cautious about those in the Weakening quadrant.
*RRG® charts show you the relative strength and momentum of groups of digital assets. That with strong relative strength and momentum appears in the green Leading quadrant. As relative momentum fades, they typically move into the yellow Weakening quadrant. If relative strength then fades, they move into the red Lagging quadrant. Finally, when momentum picks up again, they shift into the blue Improving quadrant.
Crypto (Digital Assets) compared with global equity
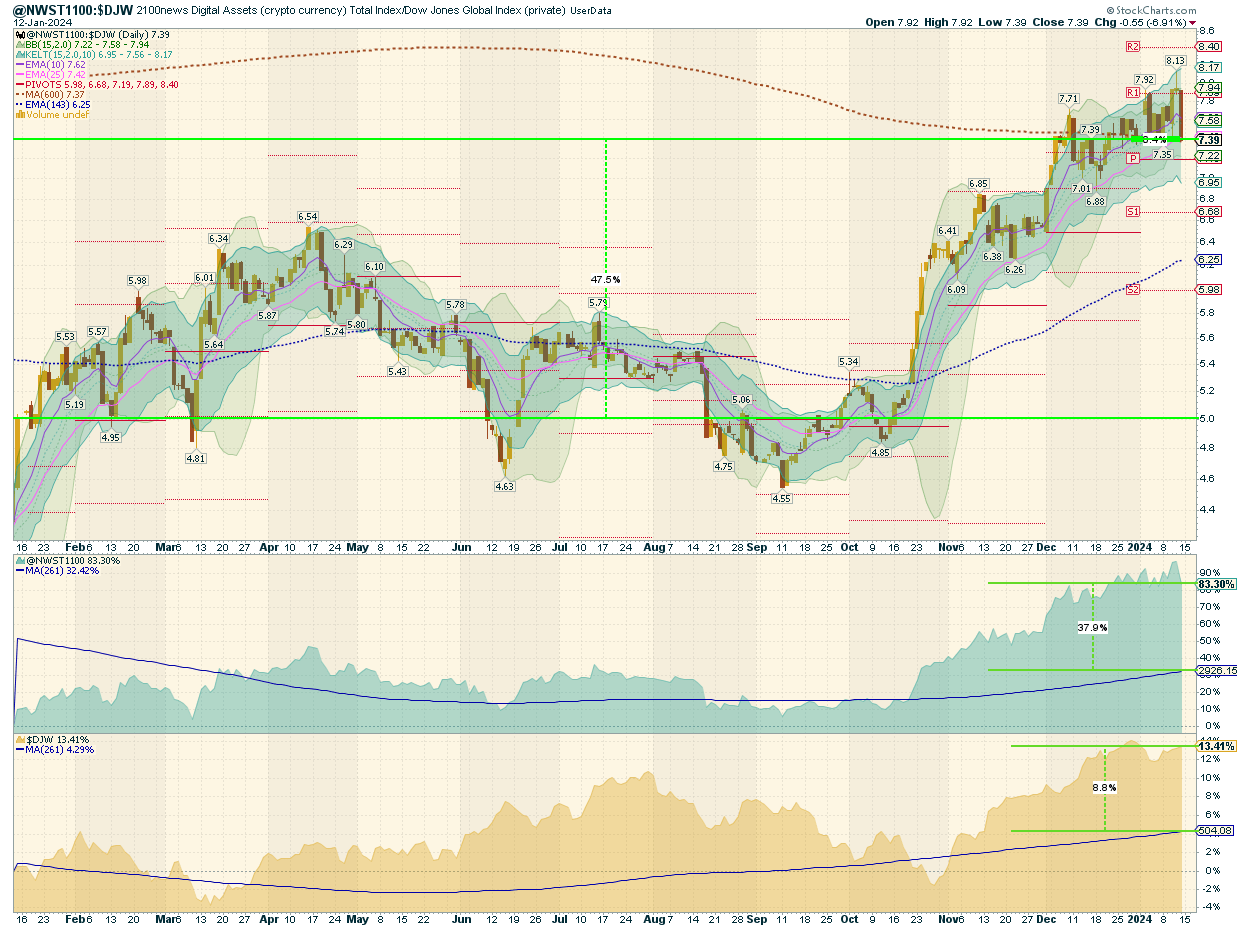
This report offers a comprehensive analysis comparing the performance of digital assets, as signified by the NWST1100 index, to shares on global capital markets, as represented by the Dow Jones Global W1Dow index. The comparison spans various timeframes, offering insights into historical and recent performances and potential future trends.
Let’s break down the key observations and implications:
- Historical Performance Comparison:
- 26 Months Ago: Digital assets, represented by the NWST1100 index, were outperforming shares on capital markets, represented by the W1Dow index, with a record high quotient between the two indexes. At this juncture, digital assets displayed a notably superior performance trajectory compared to shares on global capital markets.
- 12 Months Ago: Fast-forwarding to a year back, digital assets had a clear edge, outperforming shares by 47.5%. This performance data accentuates the heightened returns digital assets offered over shares in the specified duration.
- Mean Reversion Opportunity:
- The average quotient price over the past 143 working days is plotted as a blue dashed curve (6.25). Currently, this average sits near its long-run mean, hovering around 7.37. However, the spot price is 7.39.
- The mean reversion theory suggests that asset prices, over time, tend to revert to their historical average returns. The current average quotient price at the long-run mean could imply that digital assets are fairly valued compared to historical trends.
- Returns Comparison:
- The chart also presents the returns achieved with the stock generated by buying one point of the respective index daily over the past twelve months.
- The NWST1100 Crypto Index enjoyed an 83.30% appreciation relative to last year’s period. With daily index investments, an investor’s stock would have seen a 37.9% uplift compared to the index’s current price.
- Contrasting with the crypto index, the DJW, representing global capital market shares, grew by 13.41% over the past year. However, a strategy involving daily purchases would have resulted in a gain of 8.8%.
- Expectations are rife as we stand the confirmed bullish trend between digital assets and global capital market shares. Digital assets purchased over the preceding year at an average price of 2926 points seem poised to offer magnified returns compared to shares as we traverse this bullish phase.
*The box in the middle of the chart shows the original NWST1100 price; at the bottom is W1Dow.
Indices Revision 1-12-2024
Based on the latest Bi-weekly revision, Bonk, Ethereum Name Services, Skale, and 1inch have improved their ranking and were added to the NWSL100 index. On the other hand, Zcash, Radix, Dash, and aelf were removed from the NWSL100 index. Several new mid-cap assets have been added to the NWSM200 index, including SATS(ORdinals), ConstitutionDAO, Braintrust, etc. More information about the additions and deletions for other indices in the family is available in each index’s presentation.


 Litecoin