


2100NEWS WEEKLY CRYPTO REPORT Jun-2

The NWST1100 index has risen by 2.53% over the previous week. Gala, Large-cap Ethereum-based Token, making the biggest leap in rank within the NWSL100 crypto index biweekly.
*Below, we present a standardized weekly report and next week’s outlook, prepared based on the Theory Swingtum of intelligent finance. We gauge the crypto market’s breadth and direction by showing charts 2100NEWS Digital Assets Total Index (NWST1100), which measures 1100 (by market capitalization) significant crypto assets’ performance. The information-laden chart is difficult to read initially, but the chart shows essential price information, crucial decisive price levels, momentum, trading volumes, and crypto market breadth.
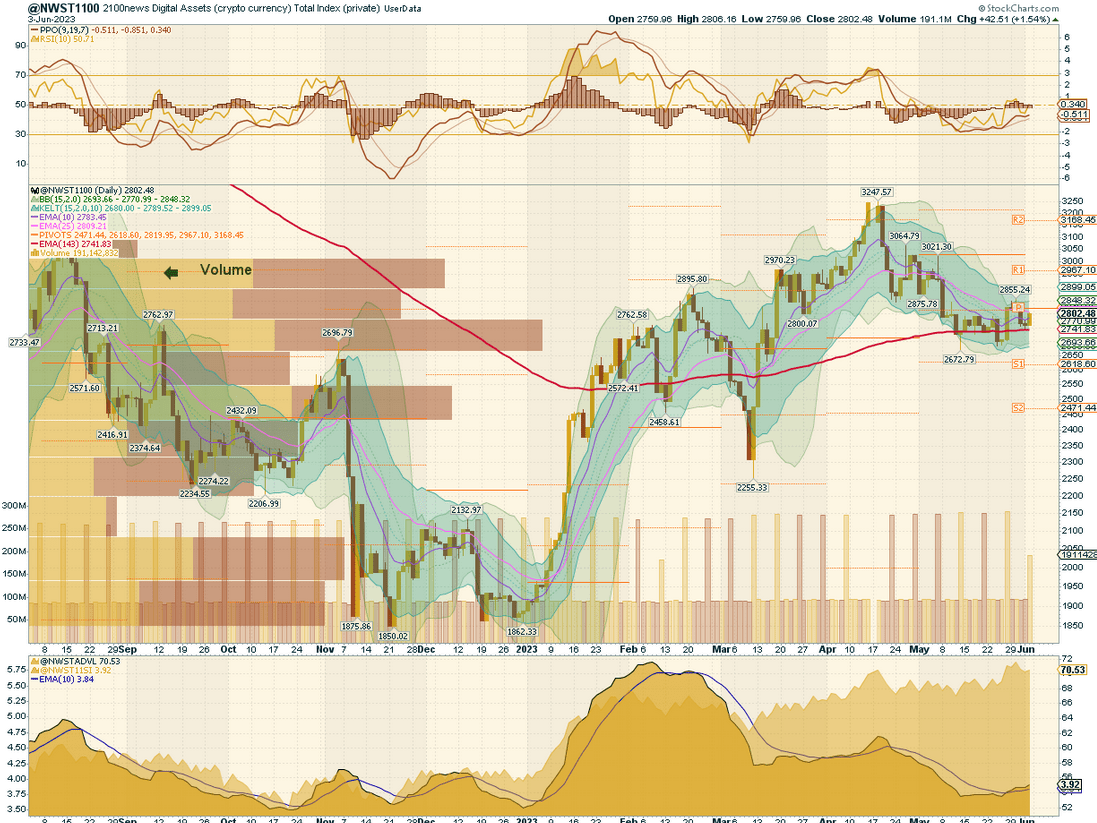
 As anticipated in the previous report, there were expectations of an upward move over pivot P. Analyzing the NWST1100 chart, a significant benchmark index reveals interesting observations regarding the market trends. The 143-DAY EMA (Exponential Moving Average) support level has held; the prices have been gravitating around the EMA for over three weeks, suggesting a period of consolidation. However, the index encountered resistance and remained stagnant, unable to break free from this consolidation phase. Several observations can be made by examining the momentum indicators at the top of the chart. Firstly, the PPO (Percentage Price Oscillator) lines have risen, indicating a growing upward momentum in the market. However, it’s important to note that the PPO histogram has flattened out, indicating a decrease in market sentiment. This suggests that the overall market sentiment remains cautious or subdued despite the upward momentum. Lastly, the RSI (Relative Strength Index) appears choppy, indicating a balanced internal strength of the market without a clear bullish or bearish bias. Two noteworthy observations can be made by shifting our focus to the Crypto Market Breadth indicators at the bottom of the chart. Firstly, the ADVL (Advance-Decline Line) has continued to fall, indicating a diminishing number of advancing assets relative to declining ones. This decline in the ADVL can be seen as a cautious signal for the overall market. Secondly, the McClellan Summation Index has risen slightly. This suggests that while there might be short-term fluctuations and minor improvements, the market has not exhibited a consistent and strong upward trend. Considering these observations, it’s evident that the market is in a state of uncertainty and consolidation; the momentum was not strong enough to initiate a substantial upward movement and instead only halted the previous decline.
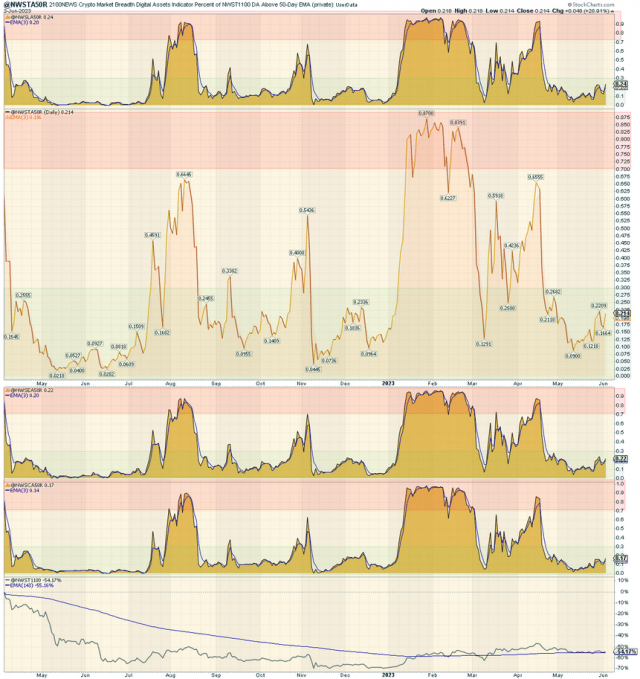
The chart on the right shows that all four A50R lines are currently oversold, a bearish signal for the crypto market. This breadth indicator measures the percentage of digital assets trading above a 50-day moving average. This suggests that the overall internal strength of the cryptocurrency market is weak.
* The percentage of digital assets trading above a specific moving average is a breadth indicator that measures internal strength or weakness in the underlying index. The chart on the right side compares the percentage of DA trading above 50 days EMA for:
- 100 Large-caps members of NWSL100 (top box)
- 1100 members of NWST1100
- 100 Ethereum Tokens members of NWSET100
- 100 Coins members of NWSCo100 (bottom box)
Outlook for this week
The cryptocurrency market waves show some degree of predictability, with discernible patterns in market behavior, although complete predictability is difficult. Examining the momentum indicators, several signals emerge for the near future. Firstly, the RSI (Relative Strength Index) currently stands at 51, reflecting a neutral sentiment prevailing. Secondly, the PPO (Percentage Price Oscillator) histogram may change its current direction, and the PPO lines may change their trajectory. Additionally, the Breadth indicators at the bottom of the first chart (NWST1100) may change direction. Considering these signals, it indicates a market environment characterized by a slightly bearish sentiment, with potential shifts in momentum and a stabilization of market breadth. Based on this setup, a test of support S1 is likely, but a sharp rebound from that level is possible.
Performance of various groups of Digital Assets (Coins and Tokens)
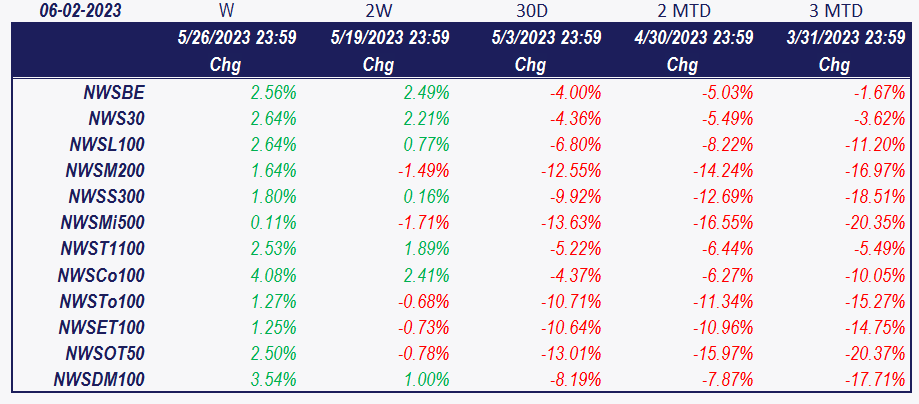
Based on the data in the table, the overall index in NWST1100 has risen by 2.53% over the past week. The chart below highlights the performance of several cryptocurrencies, including Bitcoin, Ether, and the 2100NEWS Indices, which measure the performance of Ethereum-based tokens (NWSET100), Large caps (NWSL100), and Coins (NWSCo100). Looking back over the last thirty days, Ether seems to have performed the best, with a fall of 0.47%.
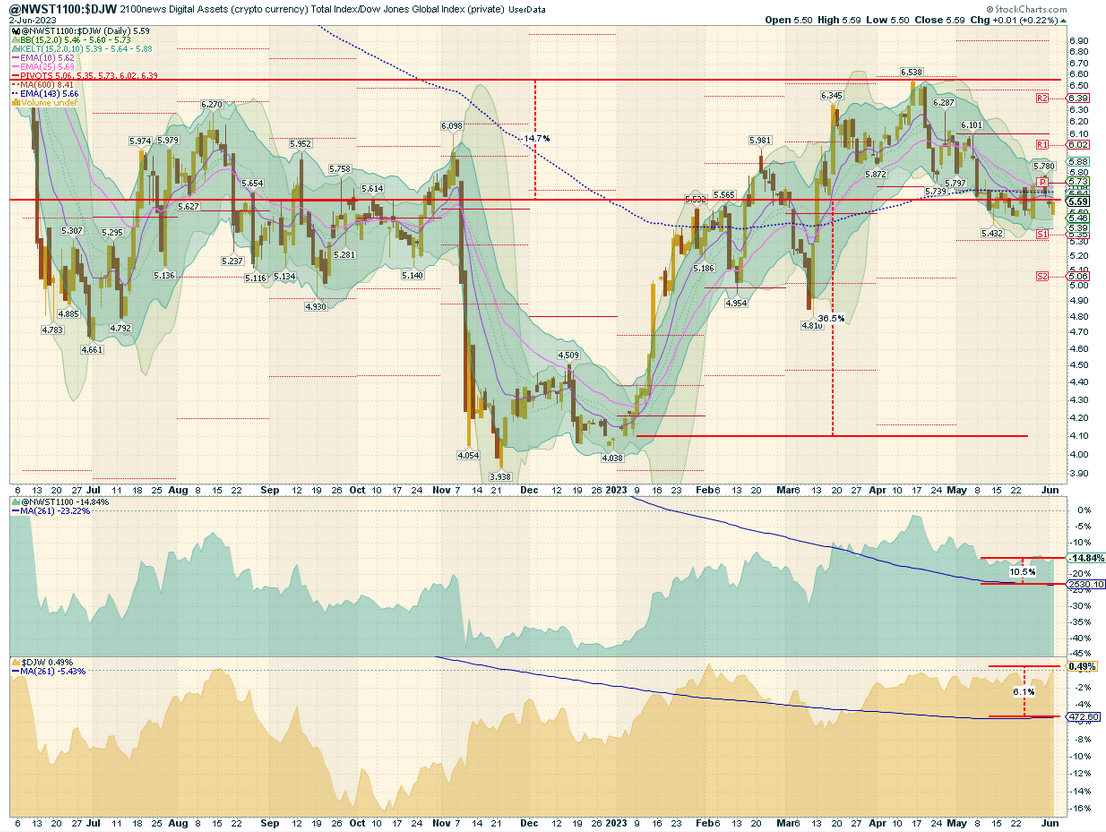
Crypto (Digital Assets) compared with global equity
These comparisons provide insights into the relative performance of digital assets and traditional stocks over different time periods.
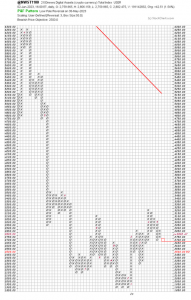
The provided comparison highlights the performance differences between digital assets (coins, tokens) and traditional stocks, represented by the NWST1100 and Dow Jones Global W1Dow indexes, respectively. Here are the key observations from the information you provided:
- Performance Comparison: 19 months ago, digital assets were performing better than traditional stocks, with a record high quotient between the NWST1100 and W1Dow indexes. However, over the past 12 months, traditional stocks have outperformed digital assets by 14.7%.
- Recent Shift: There has been a recent shift in performance in the current year, with the NWST1100 index outperforming the W1Dow index by 36.5%. This shift potentially indicates a resurgence in the performance of digital assets.
- Mean Reversion Opportunity: The blue dashed curve on the chart represents the average quotient price over 143 working days, which has been lower than the long-run mean at 8.41. This suggests that digital assets may present an opportunity for buying at lower prices based on the theory of Mean reversion. Mean reversion theory suggests that asset prices and historical returns tend to revert to their long-run means over time.
- Annual Average Returns: The bottom two boxes on the chart depict the average yearly returns of buying one point of the respective indices daily (blue curves). The Crypto Index NWST1100 experienced a 15% decrease compared to a year ago. On the other hand, purchased stock from the NWST1100 has yielded a return of 10.5%. Despite the higher price of the DJW capital index, the achieved return of the purchased stock is 6.1% based on buying one point daily.
*The box in the middle of the chart shows the original NWST1100 price; at the bottom is W1Dow.
Indices Revision 6-2-2023
Based on the latest Bi-weekly revision, Gala, GateToken, and UNUS SED LEO have improved their ranking and were added to the NWSL100 index; they were previously included in the NWSM200 index. On the other hand, HEX, Osmosis, and yearn.finance were removed from the NWSL100 index. Several new mid-cap assets have been added to the indices, including ABBC coin, Akash Network, Bifrost, etc. More information about the additions and deletions for other indices in the family is available in each index’s presentation.
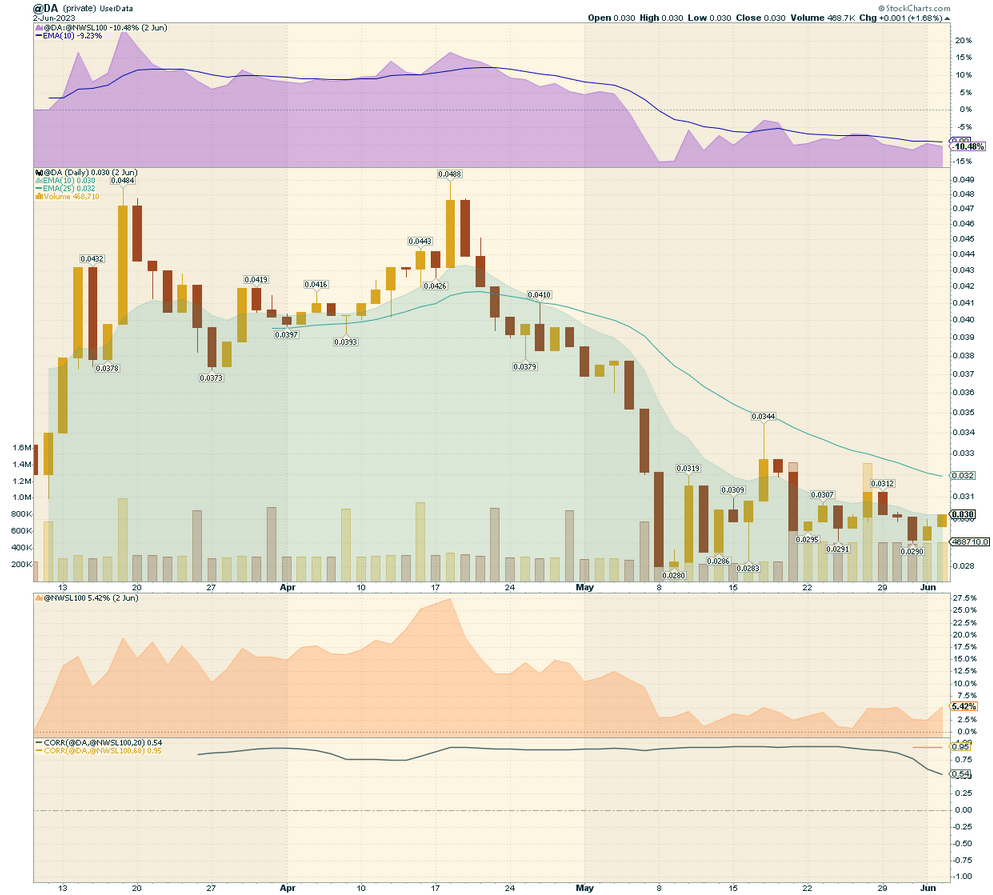
Winning member
Congratulations to Gala (GALA) for being the winning member of the NWSL100 crypto index with the most significant rank jump. We gauged Gala (GALA)) Large-cap Ethereum-based Token with 2100NEWS Digital Assets 100 Large Cap Index (NWSL100) to make an appropriate peer comparison. On average (violet area chart), the relationship between NWSL100 and GALA has shown that NWSL100 has outperformed GALA by 10% over the previous ten weeks. First, compare the GALA green area graph with the index (orange area graph) while observing the correlation graph. The correlation graph explains the strong correlation (Pearson’s correlation coefficient = 0.95). It was moving in the same direction as the NWSL100; however, it has been a good representative of the NWSL100 index regarding price changes.
*We elect the member of the NWSL100 crypto index with the most significant jump in our ranking. We will examine how the market rates the project’s progress in case of price changes. It seems important to us whether the project is out of the ordinary tide of crypto project prices. Peer comparison should be efficient and effective, considering an investor’s point of view.
![]()
Gala (GALA) Website: https://gala.com/
GALA Large-cap Ethereum-based Token is 76th in the 2100NEWS ranking. It is an Index member: NWST1100, NWSL100, NWSTo100, NWSET100
2100NEWS DA Orderbook Quality Evaluation Grade: Poor, 14.7 (Average for Large-caps: 18.5)
Over the last week, the average market cap was $459.9 million, and the average daily volume was $45.8 million.
GALA claims to be designed to power the Gala Games ecosystem to support gaming re-imagined to benefit creators and players alike. Founded by greats from the gaming and blockchain industry, Gala Games is redefining the gaming world. All OLD-school gamers remember the sound of blowing the dust out of a Nintendo cartridge to get ready to play their favorite game or the pride you took in lining up your PlayStation games on a shelf in your bedroom.
*The chart below shows the GALA compared to NWSL100 at the top, the box in the middle of the chart shows the original price, and at the bottom, we see NWSL100 and the correlation between GALA and NWSL100.


 Litecoin