


2100NEWS WEEKLY CRYPTO REPORT Apr-19
Over the past week, NWST1100 increased by 3.30%, the price was hovering near the support represented by the Pivot line and this support held. At the end of the week, NWST1100 price moved into the upper Keltner band. This year crypto investment represented by NWST1000 has beaten W1Dow (global equity) by 25.70%.
*We gauge the crypto market breadth and direction of the market by showing charts 2100NEWS Digital Assets Total Index (NWST1100) which represent the top 1100 Digital Assets. The chart overwhelmed with information is at first glance difficult to read but on the chart is the most important price information, important decisive price levels, momentum, volume of trading, and crypto market breadth.
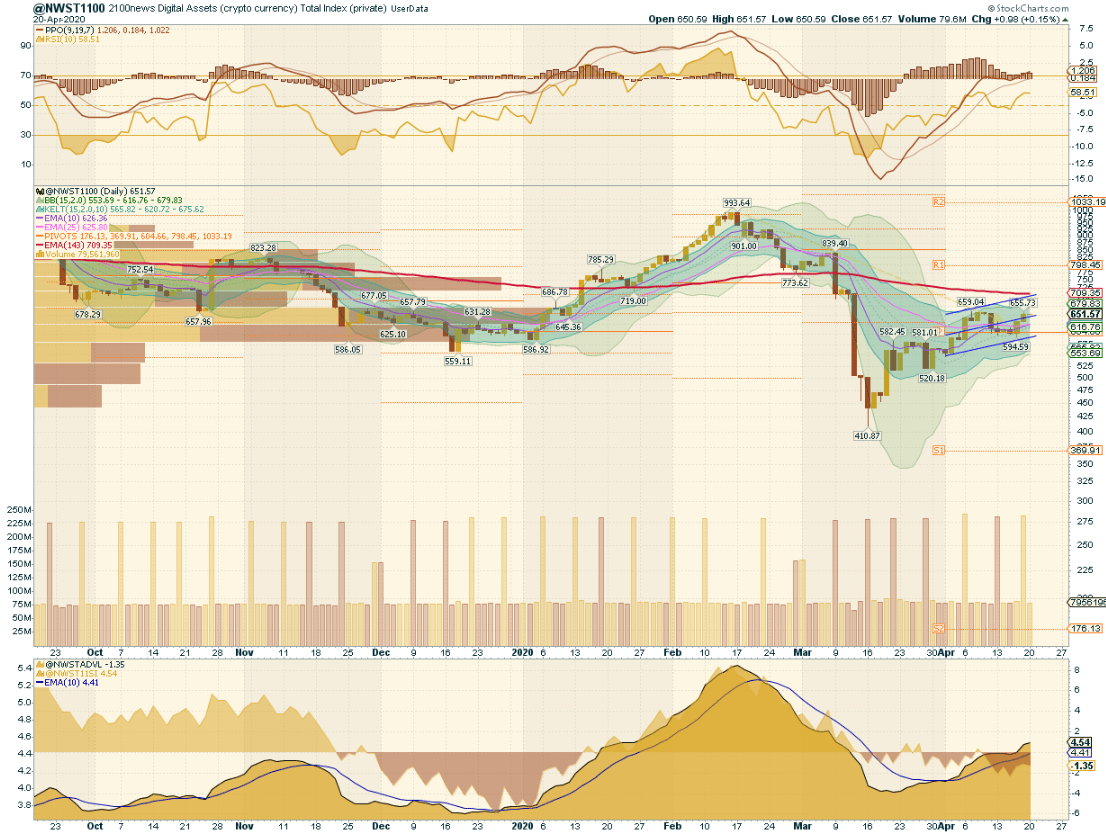
It was said in the previous report, that for the past week our assumption had been: the continuation of a sideways trend was more likely, but we could say sellers are strong and they control the market. Looking at the chart NWST1100 above we can see, the price was hovering near the Pivot line. This level acted as support and support held. At the end of the week, the price moved into the upper Keltner band. Indicators: RSI, PPO and PPO histogram bars flattened out.
Outlook for this week
Looking ahead, the indicators give us the following signals: at the top, we can see momentum indicators, RSI is 58 just above the midpoint and suggests a balance between the bulls and the bears. PPO and PPO histogram bars could start sloping down in the next few days. While we warn that corona pandemic and 143-day EMA (working days) present a barrier to further growth. The Breadth indicators could flatten out. This set up is the basis for my opinion: the sideways trend is more likely, the price could linger inside the lower Keltner band.
Performance of different groups of Digital Assets (Coins and Tokens)
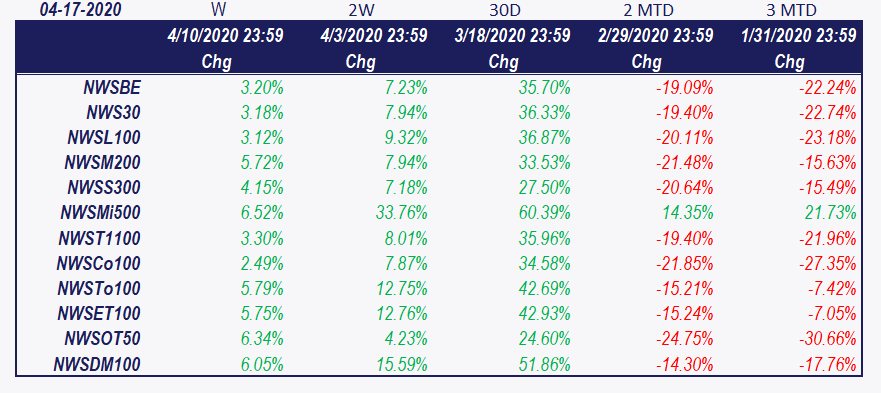
Looking at the table, you can see crypto markets continued the rebound last three weeks. The total (NWST1100) index increased by 3.30% in the past week.
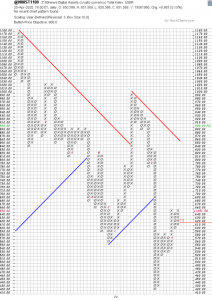
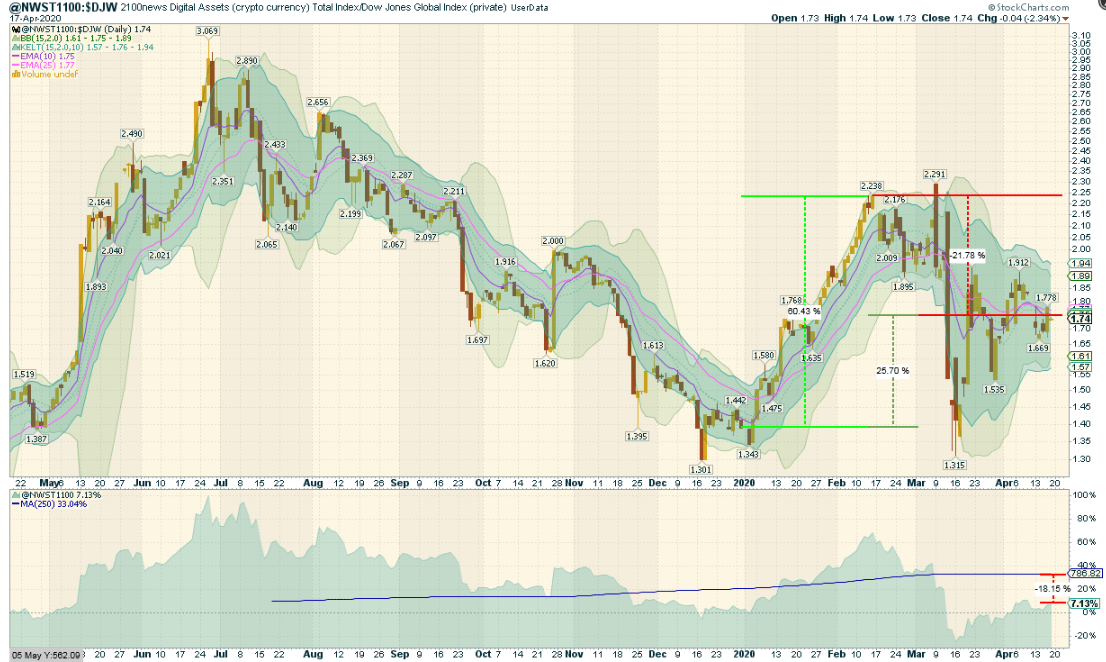
Crypto (Digital Assets) compared with global equity
On the chart below, the performance of the average Digital Aset represented by our NWST1100 index is compared with the average global equity represented by Dow Jones global index W1Dow. This year the NWST1100 had beaten W1Dow by 60% in January then pair experienced pullback in corona’s collapse, crypto markets had fallen more than equity and lost their advantage. The last weeks NWST1100 vs. W1Dow rebounded. This year crypto investment represented by NWST1000 has beaten global equity by 25.70%.


 Litecoin