


2100NEWS WEEKLY CRYPTO REPORT Mar-20

The crypto index NWST1100 increased 0.71% last week. However, the week was not a clean continuation move: an early breakout above the first major repair ceiling failed, and the market slipped back into its prior trading range by the close. Over the past 30 days, Ether emerged as the strongest relative performer, posting a gain of 14.51%.
*Below, we present a standardized weekly report and next week’s outlook, prepared based on the Theory Swingtum of intelligent finance. We gauge the crypto market’s breadth and direction by showing the 2100NEWS Digital Assets Total Index (NWST1100), which measures the performance of 1100 (by market capitalization) significant crypto assets. The information-laden chart is initially complex to read, but it effectively displays essential price information, key decision-making levels, momentum, trading volumes, and crypto market breadth. Monitoring Market Sentiment and Breadth is necessary to detect early signs of trend reversals or continued strength.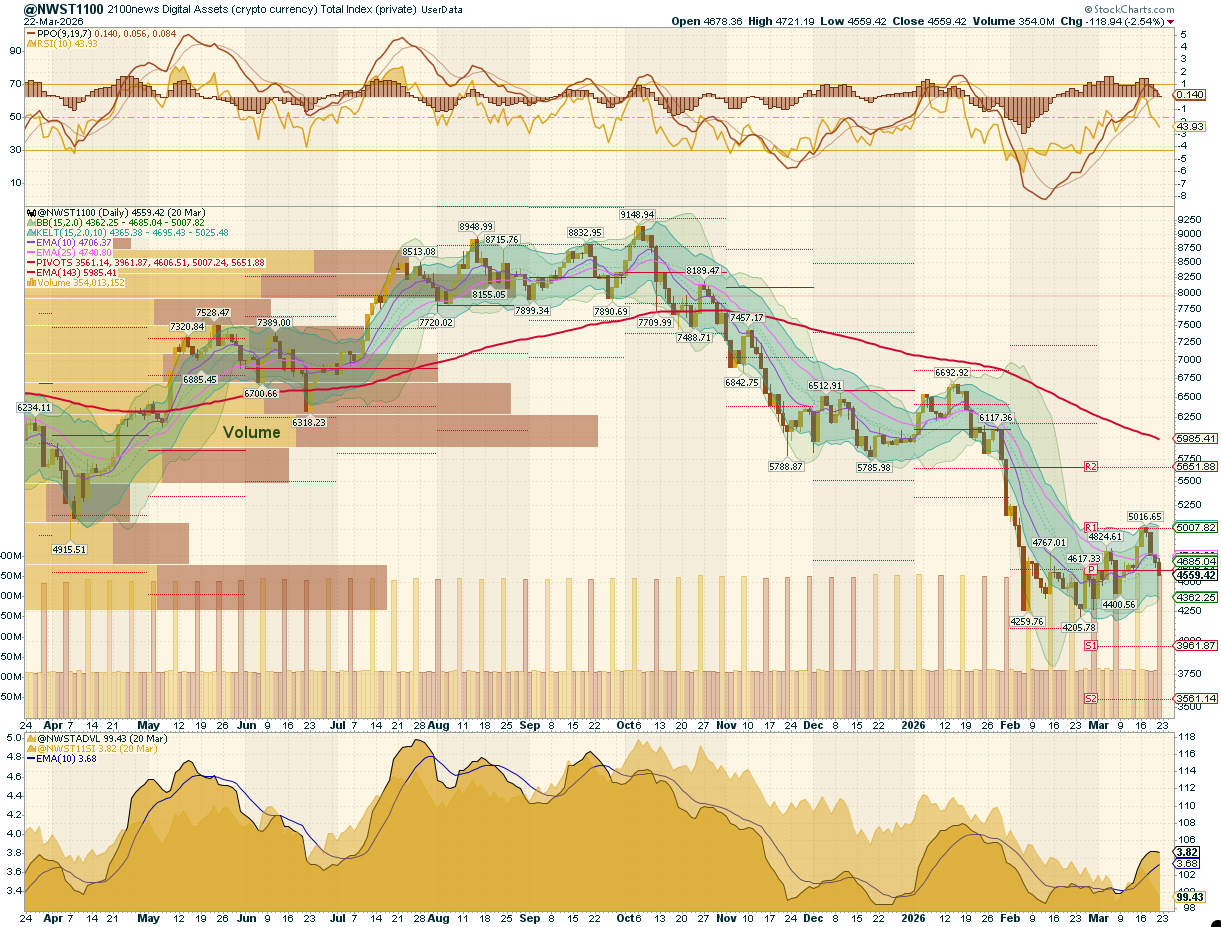
After conducting a detailed examination of the NWST1100 chart, a vital metric for the cryptocurrency market, several essential market dynamics and changes in market sentiment are revealed:
The NWST1100 index rose 0.71% over the past week, but that modest gain masks a structurally mixed period. The week began with a continuation of the prior rebound, and the market successfully pushed above the 0.236 Fibonacci retracement level near 4,762, extending toward the 5,000–5,016 area. For a brief period, price action suggested that the market was moving from repair into a higher breakout phase. However, the move did not hold. Selling pressure re-emerged in the second half of the week, the index slipped back below the Fibonacci threshold, and the period ended closer to the Pivot P / 4,650–4,700 support zone. In structural terms, the market shifted from breakout optimism back into range re-acceptance.
Market Sentiment (PPO & RSI): Momentum remains improved relative to February, but it clearly decelerated during the week. PPO lines stayed above the zero line, confirming that the earlier momentum repair remains intact. However, the PPO histogram contracted sharply while remaining positive, indicating that upside acceleration faded rather than expanded. The RSI ended near 44, down from stronger levels reached earlier in the week, and now sits in neutral territory rather than in an advancing regime. This combination is consistent with a market that has repaired enough to avoid renewed capitulation, but has not yet generated the momentum required for sustained upside continuation.
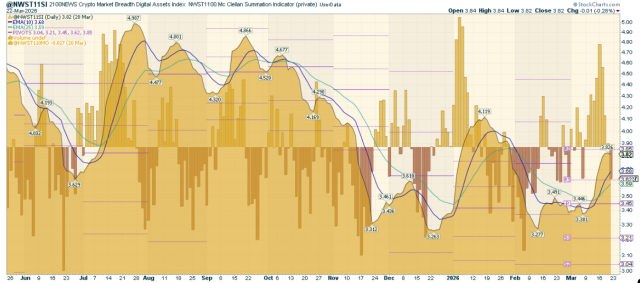
Crypto Market Breadth indicators: Breadth weakened beneath the surface during the latter part of the week. The Advance-Decline Volume Line (ADVL), adapted by 2100News for the crypto market as ADVPL, tracks the net money volume of advancing versus declining digital assets. It fell noticeably into the close, indicating that internal money flow deteriorated even as the broader market avoided a full breakdown. This points to narrowing participation and suggests that the early-week breakout attempt lost internal sponsorship. The McClellan Summation Index, a long-term breadth measure derived from the McClellan Oscillator, flattened after a strong prior rise. This means breadth is still far healthier than during the February washout, but it is no longer broadening in a way that would validate immediate upside continuation.
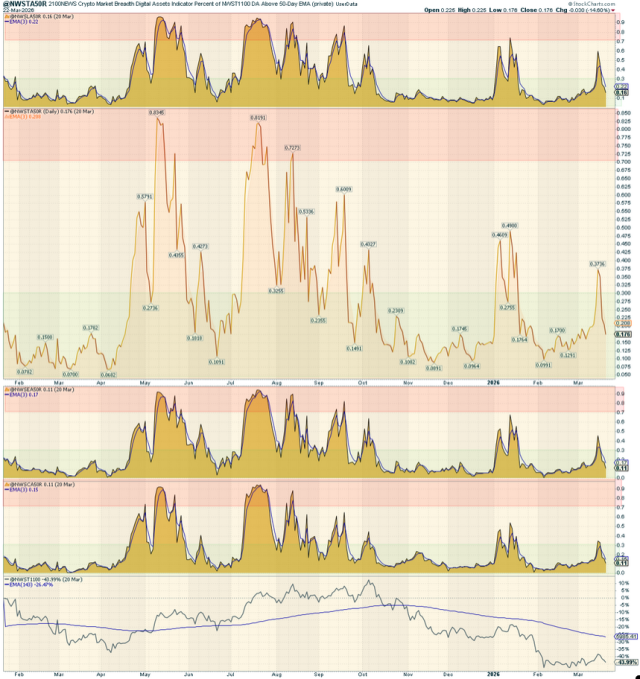
A50R Participation: According to the chart on the right, all A50R indicators across the major segments (NWST1100, NWSET100, NWSL100, NWSCo100) have remained above capitulation territory, but still reflected a market with limited participation. A50R readings — the share of assets trading above their 50-day EMAs — ended in the 11% to 18% range. The Ethereum Tokens (NWSET100) cohort remains the weakest. Large caps and the total market show slightly stronger participation, confirming that the market has moved away from the panic lows, but participation is still thin and well below levels associated with a broad bull market.
This breadth indicator measures the percentage of digital assets trading above a 50-day moving average.
* The percentage of digital assets trading above a specific moving average is a breadth indicator that measures internal strength or weakness in the underlying index. The chart on the right side compares the percentage of DA trading above the 50-day EMA for:
- Top panel: NWSL100 (Large Caps)
- Middle panel: NWST1100 (Total Market)
- Third panel: NWSET100 (Ethereum-based tokens)
- Bottom panel: NWSCo100 (Coins)
📉 Summary
The week of March 14 to March 20, 2026, was defined by a failed breakout and a return to cautious consolidation. Price initially overcame the first major repair ceiling, but the market could not sustain acceptance above that zone and slipped back into its prior range. Momentum remains constructive relative to the February low, but the impulse weakened materially. Breadth stayed positive in absolute terms, yet narrowed during the week, and A50R participation remains too low to support a full expansion thesis. This remains a repair-in-range market, not a confirmed trend transition. The market is stronger than it was a month ago, but it has not yet demonstrated the breadth or persistence needed to turn a breakout attempt into a durable new leg higher.
Outlook for this week
This report examines the cryptocurrency market’s short-term outlook, identifying patterns and signals that may offer insights into potential market direction. While predicting market behavior is inherently uncertain, discernible trends in momentum and market breadth indicators suggest possible developments.
- From a structural standpoint, the market has rotated back into the established 4,400–4,800 trading range, which has defined price behavior since late February. The recent attempt to break above the 0.236 Fibonacci resistance failed, but importantly, the market did not follow through to the downside. Instead, price is consolidating above the mid-range support zone, suggesting that the broader repair process remains intact, rather than transitioning back into a directional decline.
- The RSI (Relative Strength Index) stood at 44 last week, indicating a cooling from recent highs without returning to oversold conditions. This positioning is characteristic of consolidation within a repair phase, rather than renewed liquidation pressure.
- The PPO histogram, which measures the rate of change (i.e., the first derivative) of the PPO lines, is now approaching the zero line from above, reflecting a completed positive momentum phase that is gradually losing acceleration. Under typical market conditions, this would imply an imminent transition into a negative momentum wave. However, this transition may be delayed or softened. End-of-quarter positioning and seasonality can provide short-term support, allowing the histogram to stabilize or briefly rebound near the zero line, rather than immediately crossing into negative territory. At the same time, PPO lines are flattening, reinforcing the view of momentum normalization rather than expansion.
- At the same time, this neutralization of momentum is mirrored in the price structure. Short-term moving averages (EMA 10 and EMA 25) have flattened and converged, with price oscillating around them. This configuration reflects equilibrium and directional indecision, where neither buyers nor sellers maintains control.
- The Breadth indicators at the bottom of the first chart (NWST1100) confirm the same message: The ADVPL forced liquidation flows have subsided and may transition into mild accumulation. At the same time, the McClellan Summation Index may flatten, indicating that internal participation has stabilized but is not expanding.
📌 Target and Scenario Considerations:
Most likely scenario:
📍 Key Levels to Watch:
-
Support: 4,550–4,650 (mid-range support / Pivot zone)
-
Resistance: 4,800 (0.236 Fibonacci threshold / failed breakout ceiling)
Performance of different groups of Digital Assets (Coins and Tokens)
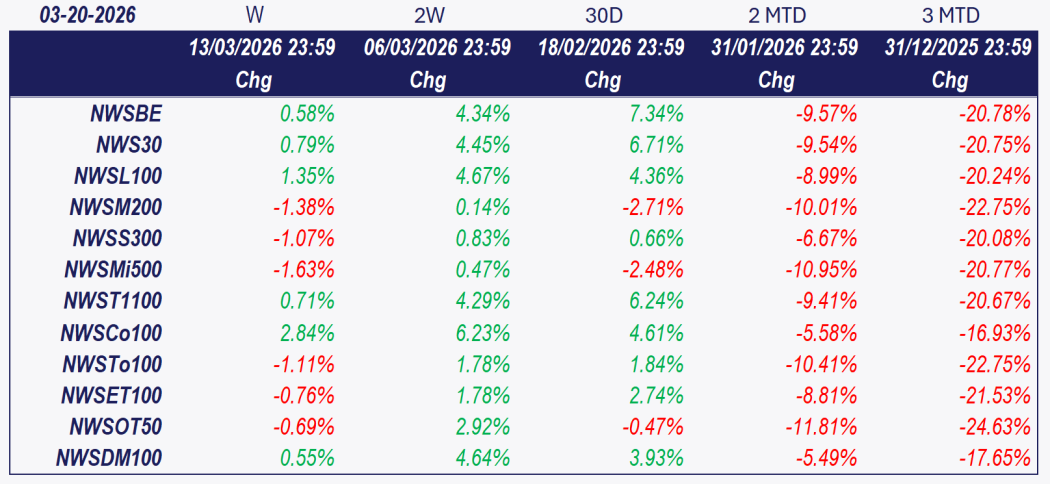
Investors and traders rely on historical performance data to contextualize short-term moves and assess the relative strength of different market segments. The latest table shows a rise across half categories, with the NWST1100 index rose 0.71% over the past week. 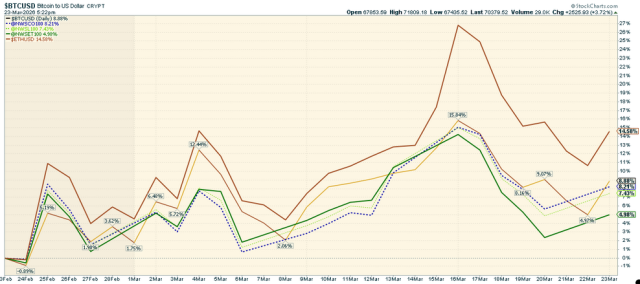 The chart above highlights the performance of various cryptocurrencies, including Bitcoin, Ether, and the 2100NEWS Indices, which represent Ethereum-based tokens (NWSET100), large caps (NWSL100), and Coins (NWSCo100). Over the past 30 days, Ether emerged as the strongest relative performer, posting a gain of 14.58%.
While the broader market has increased, different segments and individual cryptocurrencies exhibit distinct performance dynamics.
Performance Trends by Market Segment:
✔ Ether and NWS30 led the market,
✔ NWSCo100 (Coins) and NWSL100 (Large Caps) have been improving.
✔ Bitcoin and NWSBE have been weakening.
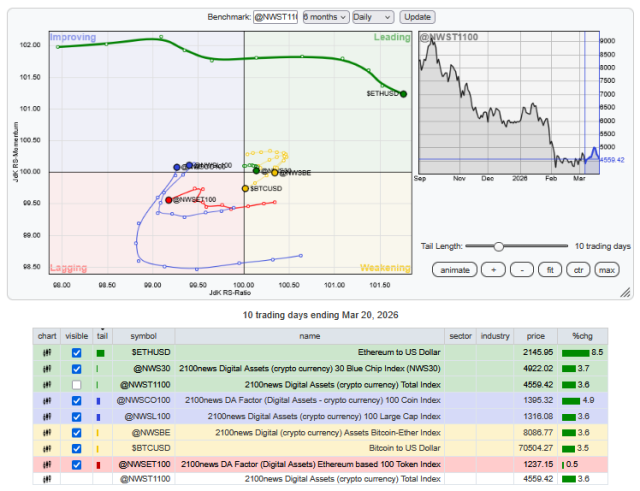
✔ NWSET100 (Ethereum-based tokens) lagged.
Investors and traders might use this information to adjust their portfolios, possibly shifting focus toward assets with stronger relative momentum while being cautious about those in the Weakening quadrant.
*RRG® charts show the relative strength and momentum of groups of digital assets. Those with strong relative strength and momentum appear in the green Leading quadrant. As relative momentum fades, they typically move into the yellow Weakening quadrant. If relative strength then fades, they move into the red Lagging quadrant. Finally, when momentum picks up again, they shift into the blue Improving quadrant.
Crypto (Digital Assets) compared with global equity
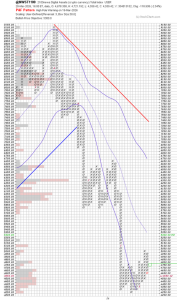
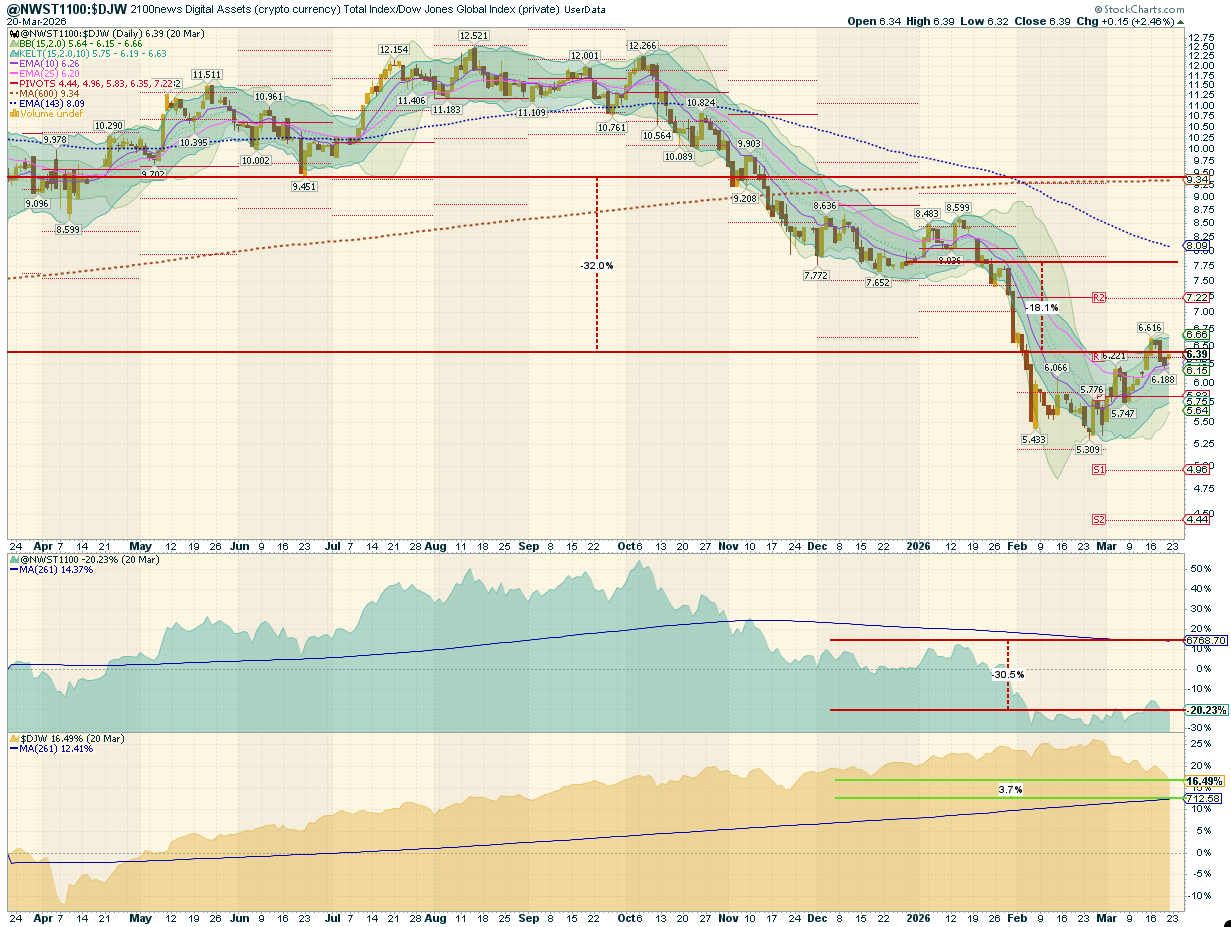
This report offers a comprehensive analysis comparing the performance of digital assets, as measured by the NWST1100 index, to that of shares on global capital markets, as represented by the Dow Jones Global W1Dow index. The comparison spans multiple timeframes, providing insights into historical and recent performances and potential future trends.
Let’s break down the key observations and implications:
- Historical Performance Comparison:
- 52 Months Ago: Digital assets vastly outperformed global equities in global capital markets, reaching a record high in the comparative quotient between the NWST1100 and W1Dow indexes. At this juncture, digital assets displayed a notably superior performance trajectory compared to shares on global capital markets.
- Over the past twelve months, digital assets have underperformed equities by 32.0%.
- Mean Reversion Opportunity:
- Over the past 143 working days, the average quotient price, represented by the blue-dashed curve, stands at 8.09, while the current spot ratio is 6.39, which is lower than the long-term mean of 9.34, which has increased since October 2024.
- The mean-reversion theory posits that asset prices tend to revert to their historical average returns over time. The current NWST1100-to-DJW price ratio, which is below the long-run mean, may indicate that digital assets are undervalued relative to historical trends.
- Returns Comparison:
- The chart also presents the returns achieved by the simplified index-based accumulation approach—buying one index point per day over 12 months—to simulate the mechanical accumulation of exposure. While this method is not equivalent to classical dollar-cost averaging (which involves investing a fixed amount of capital daily), it provides a consistent benchmark for comparing historical costs and returns. The NWST1100 Crypto Index has dropped by 20.23% over the past twelve months. With daily index investments, an investor’s stock price would have resulted in a 30.5% loss from the current index price, due to unprofitable purchases at high entry prices during a prolonged market uptrend, when prices remained above the 143-day moving average for an extended period.
- The DJW, a broad-based global equity index, has risen 16.49% over the past 12 months. However, a daily-purchase strategy would have yielded a 3.7% gain.
- Conclusion:
*The box in the middle of the chart shows the original NWST1100 price; at the bottom is W1Dow.


 Litecoin