


2100NEWS WEEKLY CRYPTO REPORT Mar-8

Over the past week, NWST1100 increased by 5.55%. Equity, commodities, and crypto have been under heavy selling pressure since Friday. The chart shows a downwards structure where the price lost ground and ended well below its 143-days EMA.
*We gauge the crypto market breadth and direction of the market by showing charts 2100NEWS Digital Assets Total Index (NWST1100) which represent the top 1100 Digital Assets. The chart overwhelmed with information is at first glance difficult to read but on the chart is the most important price information, important decisive price levels, momentum, volume of trading, and crypto market breadth.
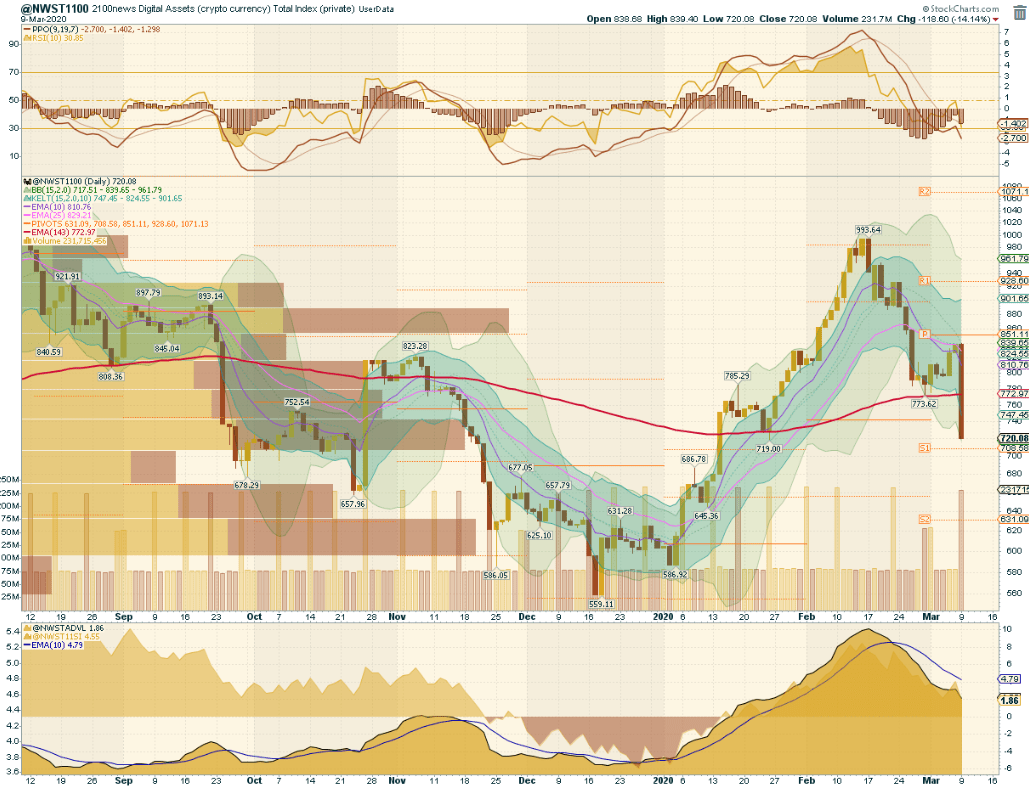
In the previous report, it was said, for the past week our assumption had been: a little more likely was a rebound up to 850 points and beyond but was also likely to continue falling with a break down to 700 points. Looking at the chart NWST1100 above we can see, the price was rising to 840. In Europe and America, it was becoming increasingly clear, however, that this new coronavirus is likely to trigger a global recession. The world economy’s prospects look bleak. Equity, commodities, and crypto have been under heavy selling pressure since Friday. The chart shows a downwards structure where the price lost ground and ended well below its 143-days EMA. PPO histogram started sloping negatively.
Outlook for this week
Looking ahead, the indicators give us the following signals: at the top, we can see momentum indicators, RSI is 30 – bearish, PPO could continue sloping negatively but PPO histogram bars could again start slopping positively in the next few days. The Breadth indicators could flatten out. This set up is the basis for my opinion: the bottoming process is expected, but we could see an intraday drop of up to 650 points followed by an immediate rebound.
Performance of different groups of Digital Assets (Coins and Tokens)
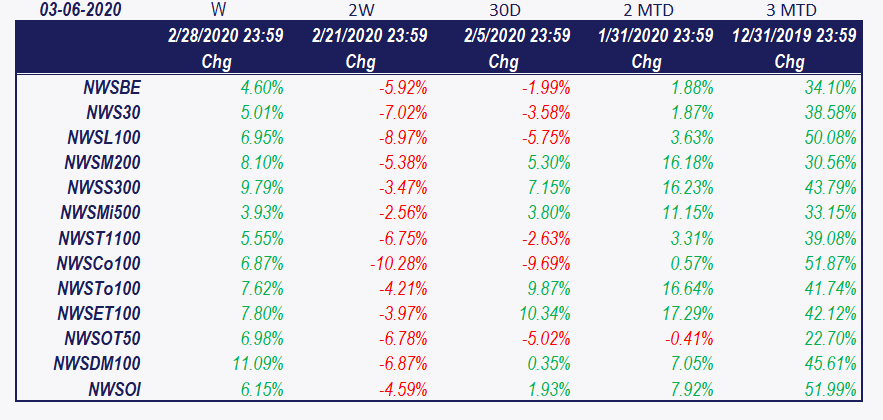
This year, NWSCo100 was undergoing some really massive bullish action and its price was making large price leaps. Looking at the table, you can see crypto markets experienced a rebound last week but since last Friday the prices have lost ground.
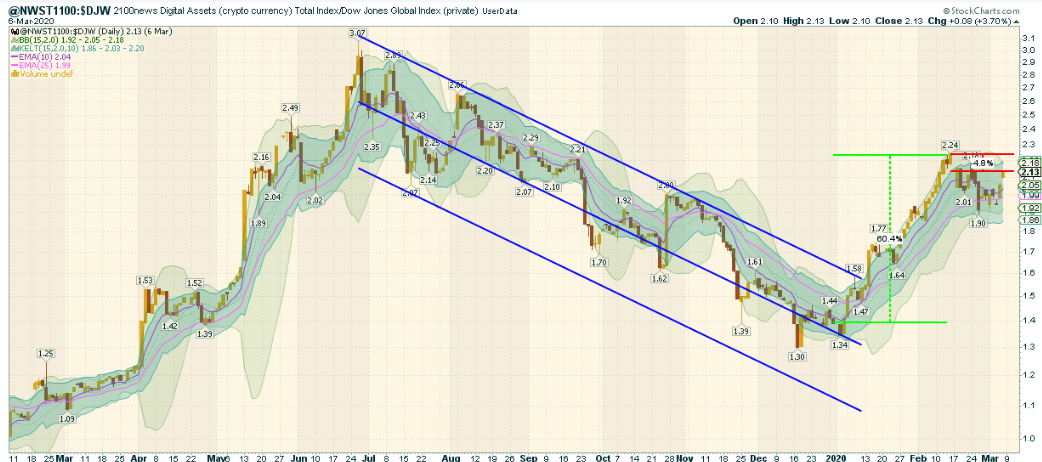
Crypto (Digital Assets) compared with global equity
On the chart below, the performance of the average Digital Aset represented by our NWST1100 index is compared with the average global equity represented by Dow Jones global index W1Dow. In the second half of the last year, crypto has fallen over 50% vs. global equity, but this year crypto is an excellent investment. Last month and last week again NWST1100 vs. W1Dow rebounded. The pair (average crypto vs. W1Dow) has soared by 52% on the year.


 Litecoin